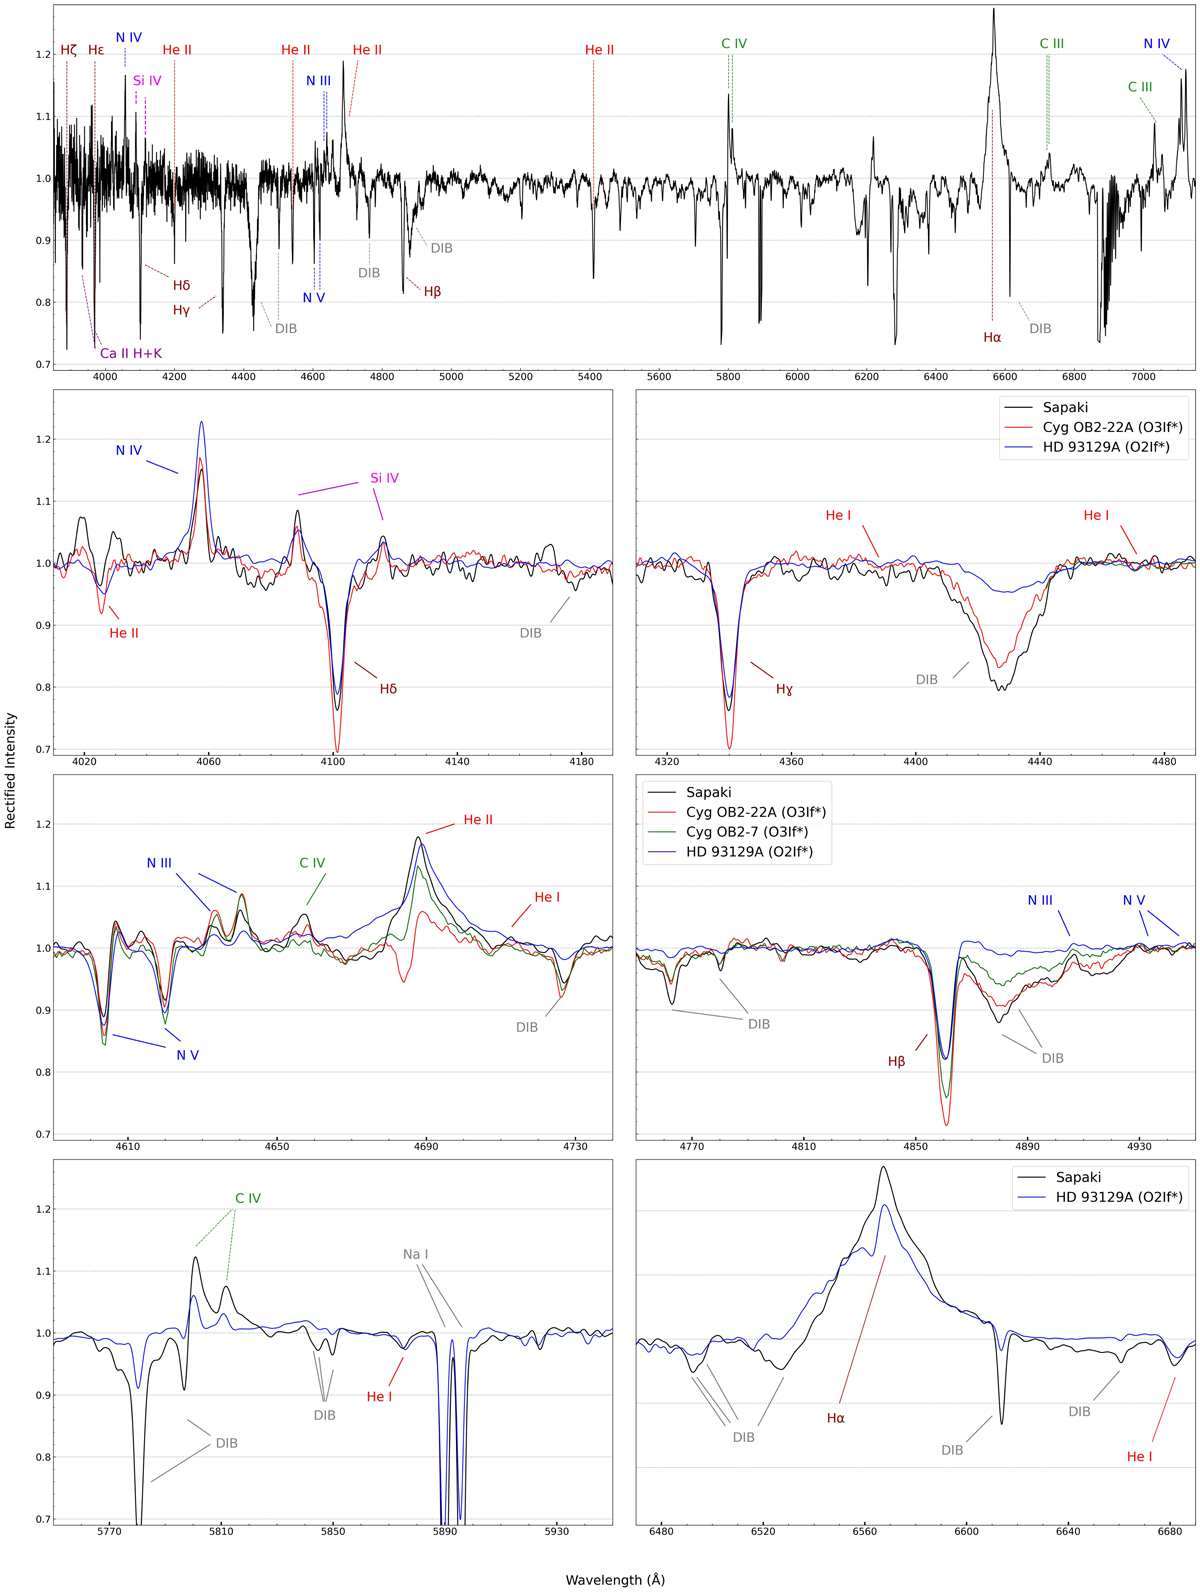
Fig. 2.
Download original image
MagE optical spectrum of Sapaki in the range 3800−7200 Å at a resolution of R = 4100, shown at the top. The remaining panels display comparisons between the spectra of Sapaki (black), HD 93129A (O2If*; blue), Cyg OB2-22A (O3If*; red), and Cyg OB2-7 (O3If*; green), in the wavelength ranges of 4010−4190, 4310−4490, 4590−4740, 4760−4940, 5750−5950, and 6470−6690 Å, at a common resolution of R = 2500. Cyg OB2-7 lacks data for the bluest and reddest regions, whereas Cyg OB2-22A lacks data in the reddest regions. The lines marked with colors are Hη, Hζ, Ca II H, Hϵ + Ca II K, He IIλ4026, N IVλ4058, Si IVλλ4089-116, Hδ, He IIλ4200, Hγ, He Iλ4388, He Iλ4471, He IIλ4542, N V λλ4604-20, N IIIλλ4634-40, C IVλ4658, He IIλ4686, He Iλ4713, Hβ, N IIIλ4905, N Vλλ4933-44, He IIλ5411, C IVλλ5801-12, He I λ5876, Hα, He Iλ6678, C IIIλλ6721-27, C IIIλ7037, and N IVλ7116. The DIBs marked are λ4179, λ4429, λ4727, λλ4762-80, λλ4881-87, λλ5780-97, λλ5843-45-50, λλ6492-94-98, λ6527, λ6613, and λ6660.
Current usage metrics show cumulative count of Article Views (full-text article views including HTML views, PDF and ePub downloads, according to the available data) and Abstracts Views on Vision4Press platform.
Data correspond to usage on the plateform after 2015. The current usage metrics is available 48-96 hours after online publication and is updated daily on week days.
Initial download of the metrics may take a while.