Fig. 8
Download original image
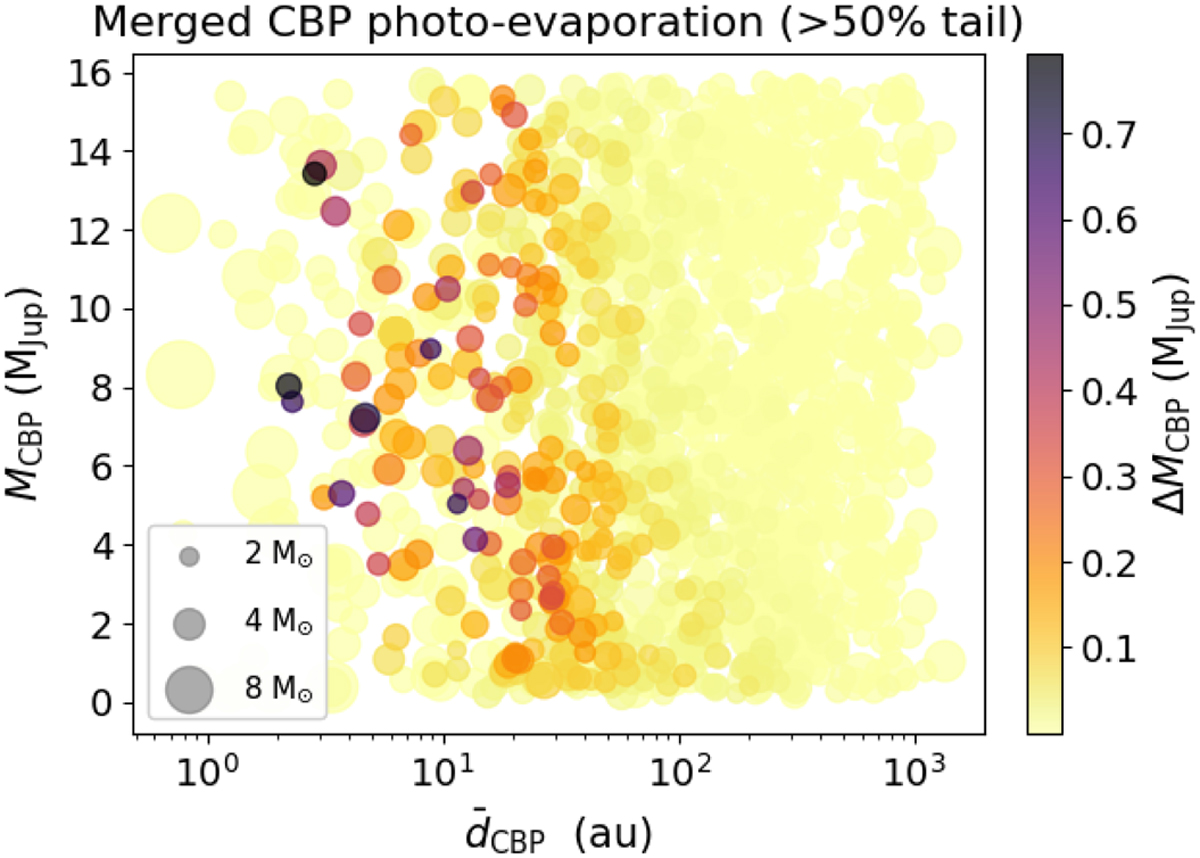
Population A: atmospheric mass loss endured by gas giants of Merged binaries, scattered in mass-distance parameter space. The x-axis corresponds to the final time-averaged orbital distance of the CBPs. Shown are the planets that lost more mass than the 50% of the category. The colour corresponds to the amount of mass lost (see colour bar). The size of the markers is proportional to the binary progenitors masses, as illustrated in the legend.
Current usage metrics show cumulative count of Article Views (full-text article views including HTML views, PDF and ePub downloads, according to the available data) and Abstracts Views on Vision4Press platform.
Data correspond to usage on the plateform after 2015. The current usage metrics is available 48-96 hours after online publication and is updated daily on week days.
Initial download of the metrics may take a while.