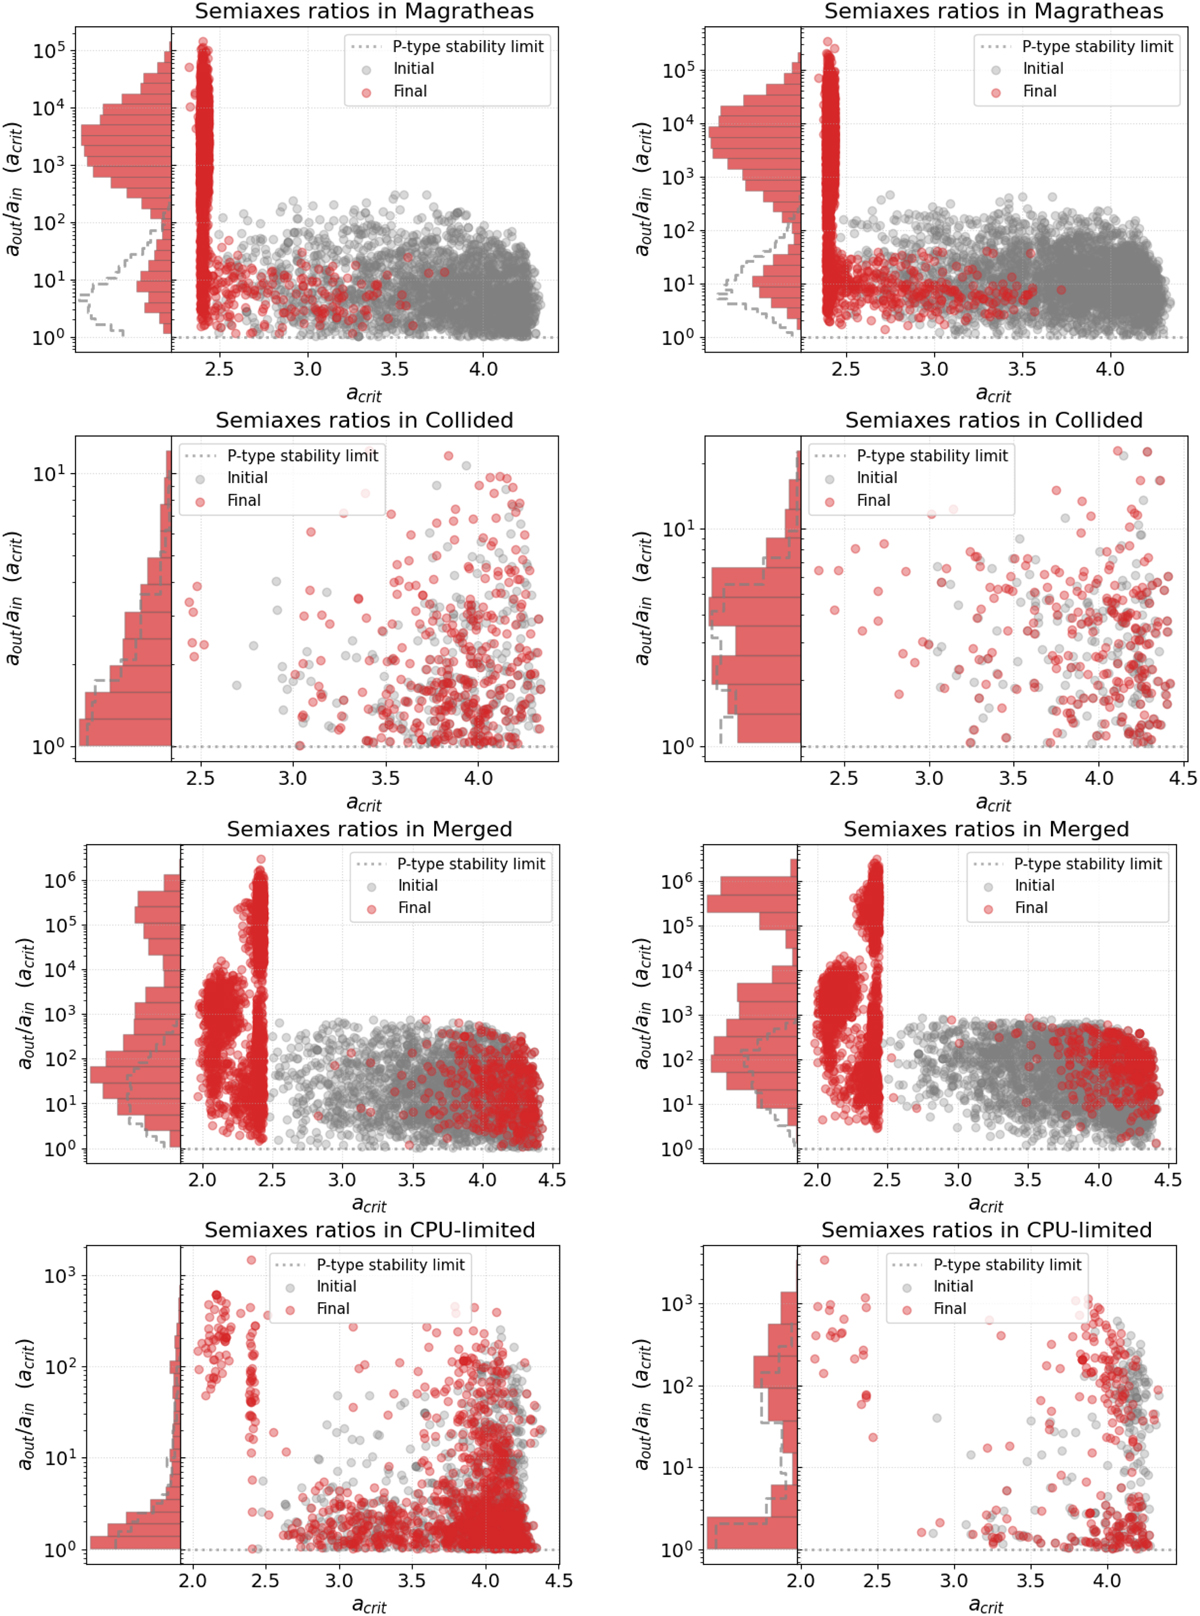
Fig. A.9
Download original image
Outer-to-inner binary semi-major axis ratio as a function of critical ratio for each system. acrit depends only on the inner binary, as shown in Sect. 2.2.1. On the left side of each plot is shown a histogram of the ratio distributions; the logarithmic bins do alter the peak’s shape, which in linear scale would always fall towards the lowest values. Left: Pop. A, right: Pop. B.
Current usage metrics show cumulative count of Article Views (full-text article views including HTML views, PDF and ePub downloads, according to the available data) and Abstracts Views on Vision4Press platform.
Data correspond to usage on the plateform after 2015. The current usage metrics is available 48-96 hours after online publication and is updated daily on week days.
Initial download of the metrics may take a while.