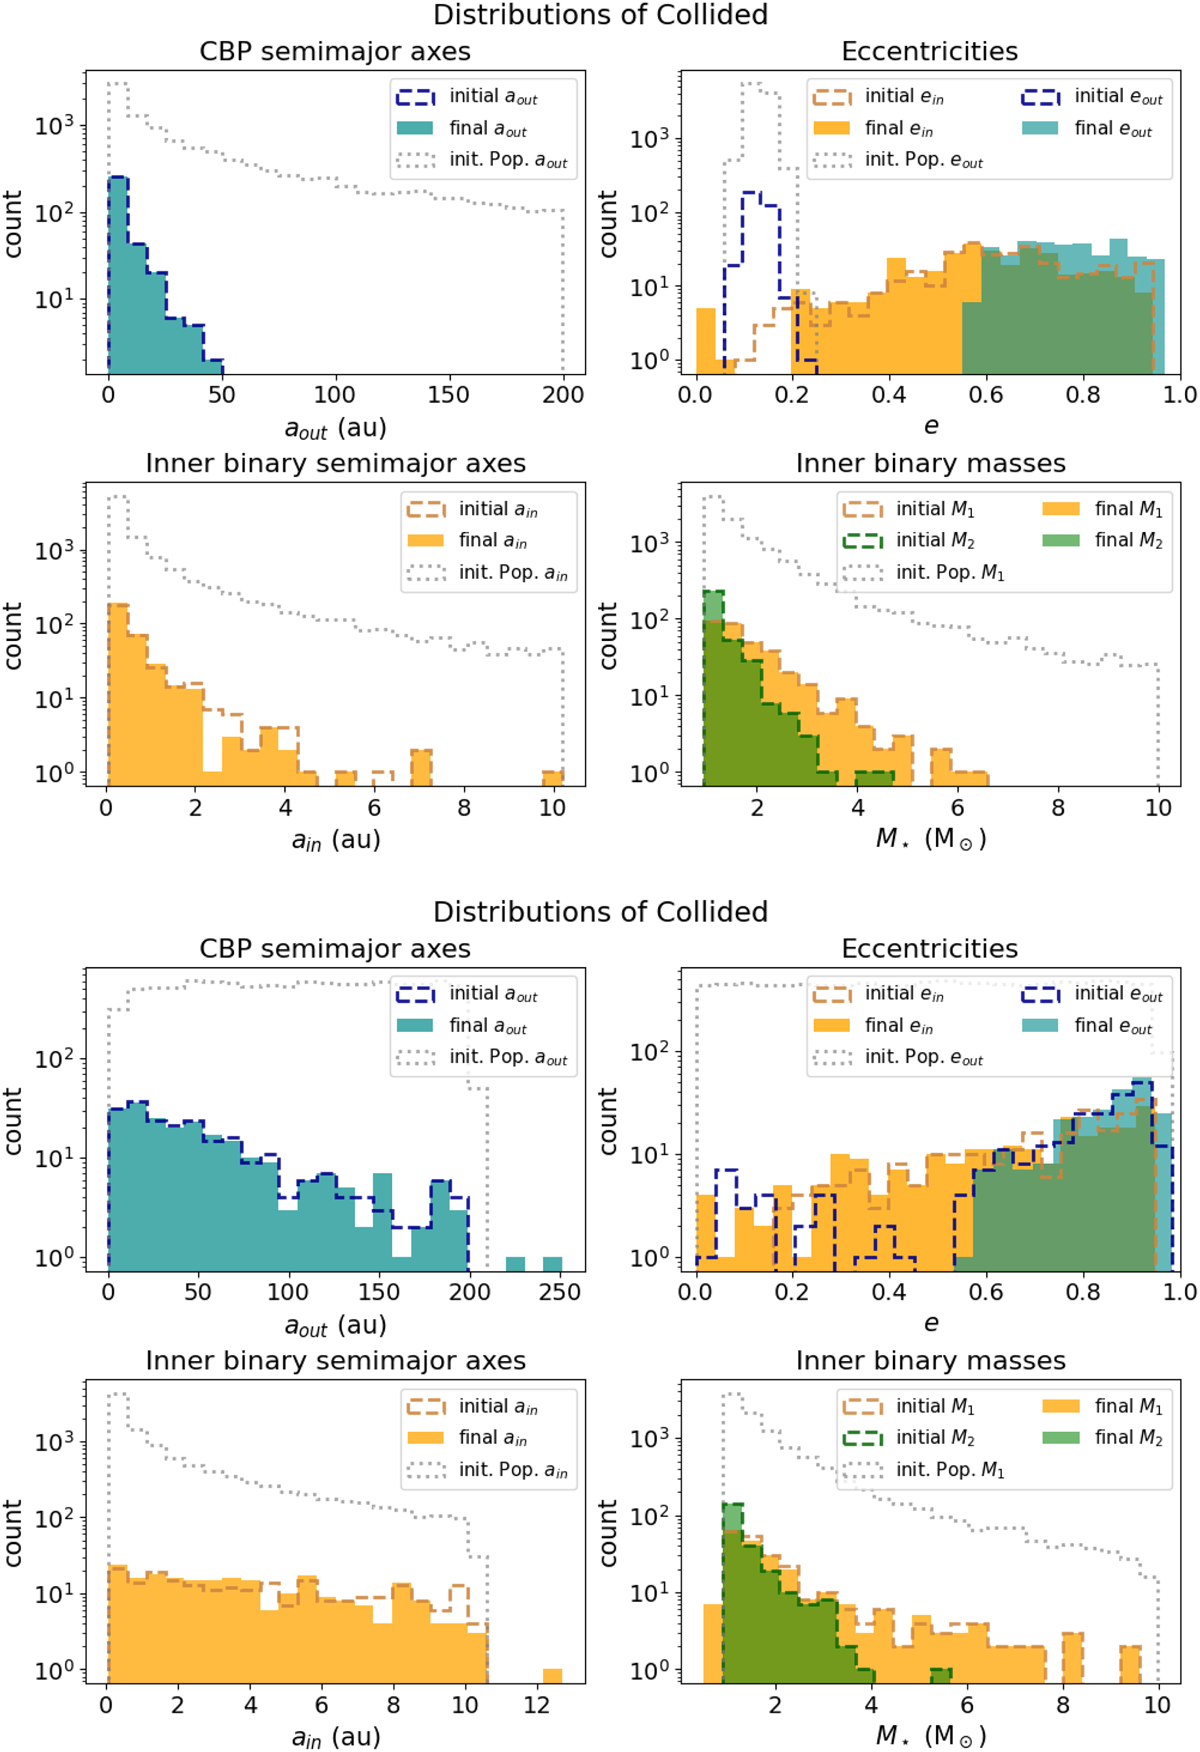
Fig. A.4
Download original image
Overview of distributions of Collided systems (see the detailed definition and caveats of this category in Sect. 4.2). The solid histograms represent the Collided parameters at one Hubble time, while the dashed lines show their initial distributions. The ‘out’ subscript denotes the planetary parameters (blue distributions). The dotted grey lines show the initial distributions for the whole population, not restricted to the Collided. Top half: Pop. A, bottom half: Pop. B.
Current usage metrics show cumulative count of Article Views (full-text article views including HTML views, PDF and ePub downloads, according to the available data) and Abstracts Views on Vision4Press platform.
Data correspond to usage on the plateform after 2015. The current usage metrics is available 48-96 hours after online publication and is updated daily on week days.
Initial download of the metrics may take a while.