Fig. 7.
Download original image
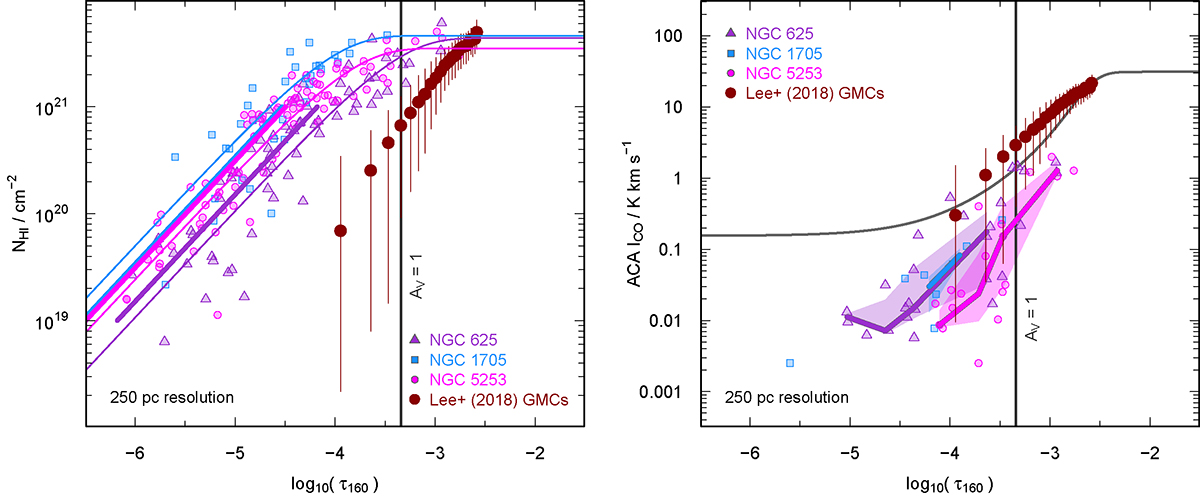
Atomic gas column density NHI versus 160 μm optical depth τ160 (left panel) and CO ACA (velocity-integrated) TB versus τ160 (right). Only regions with S/N ≥ 3 are shown (and included in the fits). The best-fit linear relations (Eq. (6)) for τ160 as a function of NHI are shown as heavy curves (in log space), and only consider the points with 1019 ≤ NHI ≤ 1021 cm−2 because of the need to consider the regions dominated by HI. The lighter curves show the fit to Eq. (5) as described in the text, and are used to determine ![]() . Also shown are the GMCs from Lee et al. (2018) assuming AV/τ160 = 2200 for consistency with their paper. The vertical line shows the equivalent of AV = 1 assuming this conversion. The heavy (colored) curves in the right panel correspond to ICO binned in log(τ160), and the gray curve is the fit from Lombardi et al. (2006) for CO in the MW Pipe Nebula GMC versus AV converted to τ160 as above (see also the study Pineda et al. 2008, on the Perseus molecular cloud complex).
. Also shown are the GMCs from Lee et al. (2018) assuming AV/τ160 = 2200 for consistency with their paper. The vertical line shows the equivalent of AV = 1 assuming this conversion. The heavy (colored) curves in the right panel correspond to ICO binned in log(τ160), and the gray curve is the fit from Lombardi et al. (2006) for CO in the MW Pipe Nebula GMC versus AV converted to τ160 as above (see also the study Pineda et al. 2008, on the Perseus molecular cloud complex).
Current usage metrics show cumulative count of Article Views (full-text article views including HTML views, PDF and ePub downloads, according to the available data) and Abstracts Views on Vision4Press platform.
Data correspond to usage on the plateform after 2015. The current usage metrics is available 48-96 hours after online publication and is updated daily on week days.
Initial download of the metrics may take a while.