Fig. 6.
Download original image
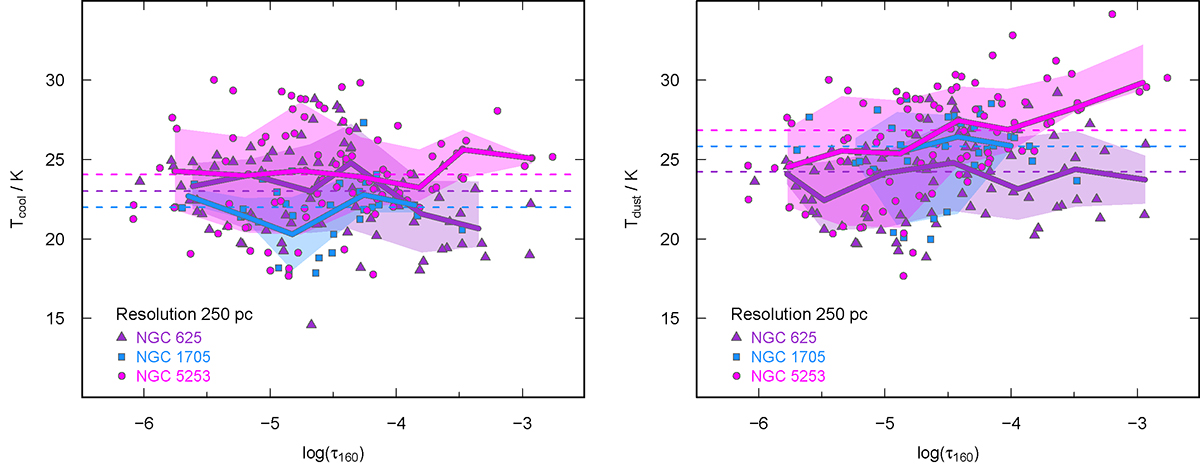
Dust temperatures plotted against τ160 for the 250 pc regions within the target galaxies: in the left panel best-fit Tcool and in the right panel effective temperature Tdust. The medians binned in log10(τ160) are shown as heavy lines characterized by different colors, with the 1σ variation by shaded regions. The horizontal dashed lines correspond to the overall Tcool galaxy medians (left panel) and Tdust (right). Only in the case of NGC 5253 does the effective temperature Tdust present a trend with τ160, in the sense that more optically thick regions show higher temperatures.
Current usage metrics show cumulative count of Article Views (full-text article views including HTML views, PDF and ePub downloads, according to the available data) and Abstracts Views on Vision4Press platform.
Data correspond to usage on the plateform after 2015. The current usage metrics is available 48-96 hours after online publication and is updated daily on week days.
Initial download of the metrics may take a while.