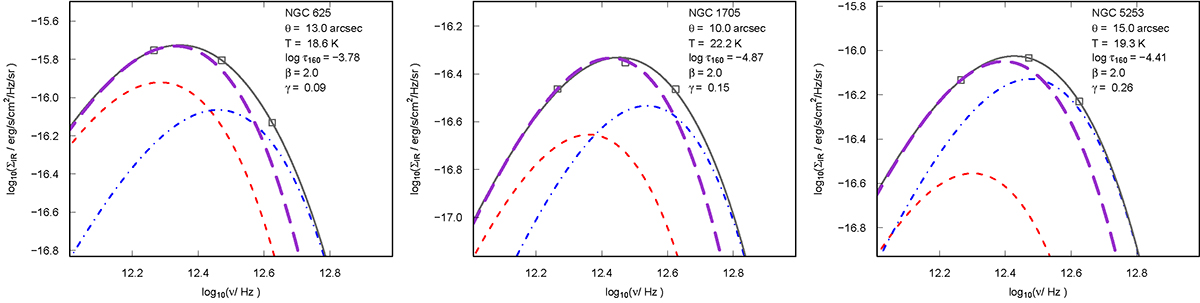
Fig. 5.
Download original image
Representative fits of Eq. (3) with significant γ values to illustrate the importance of two temperatures in the fitting function. The long-dashed red curves show the MBB with Tcool, the dot-dashed blue curves Twarm, and the gray (solid) ones the overall best fit. The (heavy) purple long-dashed curve corresponds to a single-temperature MBB with Tdust, normalized to the 160 μm data point. For γ > 0, the simple MBB is clearly missing the contribution toward higher frequencies caused by warm dust at Twarm.
Current usage metrics show cumulative count of Article Views (full-text article views including HTML views, PDF and ePub downloads, according to the available data) and Abstracts Views on Vision4Press platform.
Data correspond to usage on the plateform after 2015. The current usage metrics is available 48-96 hours after online publication and is updated daily on week days.
Initial download of the metrics may take a while.