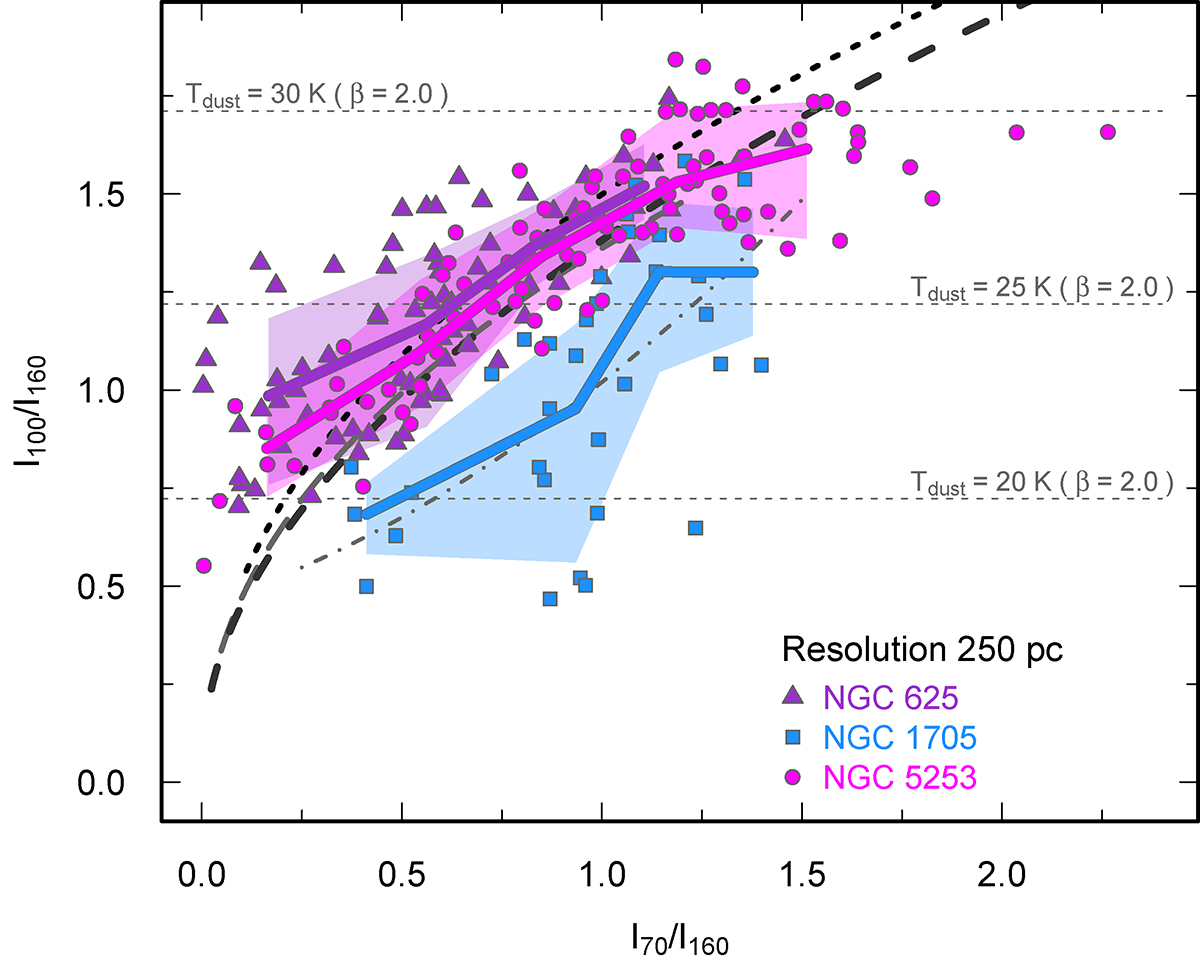
Fig. 4.
Download original image
PACS flux ratios I100/I160 versus I70/I160. The PACS data have been rebinned to ∼250 pc resolution in order to match the HI and ACA CO maps. Heavy curves show the medians in I100/I160 bins for each galaxy, and the shaded regions indicate 1σ standard deviations. Also shown are the model MBB-T2 flux ratios with γ = 0.14 (the median value for NGC 1705), indicated by the heavy black long-dashed curve. The IR ratios from two MBB models (γ = 0) are illustrated as a long-dashed (gray) curve with β = 1 (virtually indistinguishable from the MBB-T2 curve), and a short-dashed (black) curve for β = 2. The dot-dashed curve corresponds to the best fit polynomial for the SMC by Leroy et al. (2009). The horizontal lines illustrate the I100/I160 ratios that would be expected for Tdust = 20 K, 25 K, and 30 K. The line ratios for NGC 625 and NGC 5253 are fairly well approximated by MBBs or MBB-T2 fits, while the polynomial fit by Leroy et al. (2009) is a better approximation for NGC 1705. This fit is roughly equivalent to assuming that only half of the observed 70 μm emission comes from large, “classical” grains, with the other half originating from stochastic heating of small grains.
Current usage metrics show cumulative count of Article Views (full-text article views including HTML views, PDF and ePub downloads, according to the available data) and Abstracts Views on Vision4Press platform.
Data correspond to usage on the plateform after 2015. The current usage metrics is available 48-96 hours after online publication and is updated daily on week days.
Initial download of the metrics may take a while.