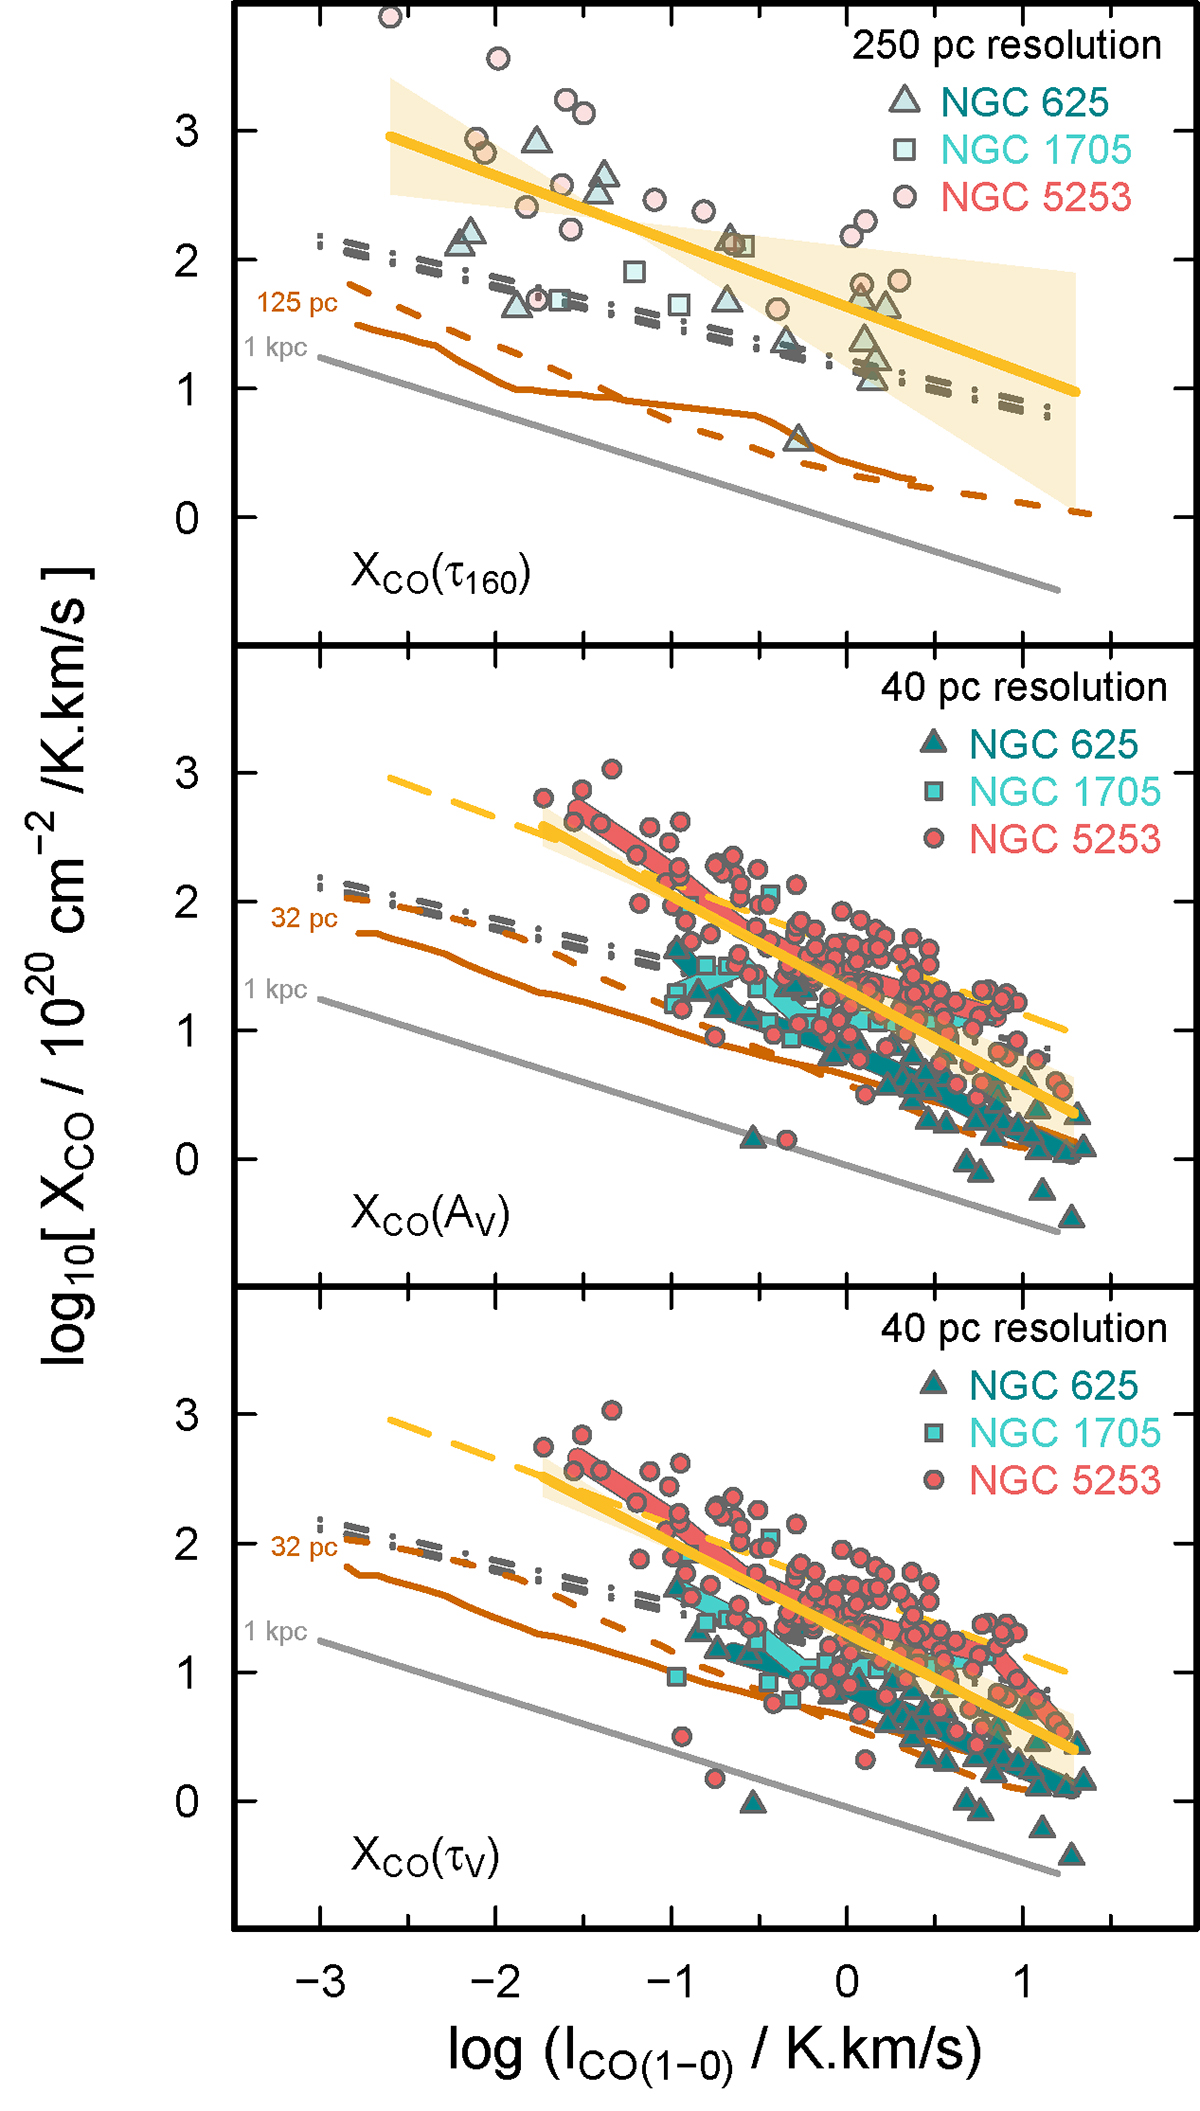
Fig. 13.
Download original image
XCO estimated from Eq. (8) versus ICO in the top panel (250 pc resolution); XCO from Eq. (14) in the middle (40 pc resolution); and from Eq. (15) in the lower (40 pc resolution). Also shown as dark-gray dot-dashed lines are the predictions from Narayanan et al. (2012) for the different metallicities of our targets. The 1 kpc trend from Hu et al. (2022), valid for all metallicities, is shown as a light-gray solid line (labeled “1 kpc”). The brown solid (dashed) curves correspond to 0.3 Z⊙ (Z⊙) metallicities at 125 pc resolution (top panel) and at 32 pc (middle and lower ones). The 0.3 Z⊙ curves are the best approximation to the metallicities of our target starbursts. The robust fit in logarithmic space to our data is shown as a dark-yellow line with 1σ excursions by the yellow shaded area; in the lower panels, the dashed dark-yellow line reproduces the 250 pc best fit shown in the upper panel. The trends seen in our data follows the predictions of Hu et al. (2022), in terms of excursion, but we find a steeper slope and an overall higher normalization. We attribute this to the theoretical W10 not being the exact same quantity as observed ICO, so we approximate W10 as ICO, which is a better approximation at high ICO, when XCO is low, but which is far from true at low ICO, when XCO is high. See text for more details.
Current usage metrics show cumulative count of Article Views (full-text article views including HTML views, PDF and ePub downloads, according to the available data) and Abstracts Views on Vision4Press platform.
Data correspond to usage on the plateform after 2015. The current usage metrics is available 48-96 hours after online publication and is updated daily on week days.
Initial download of the metrics may take a while.