Fig. 11.
Download original image
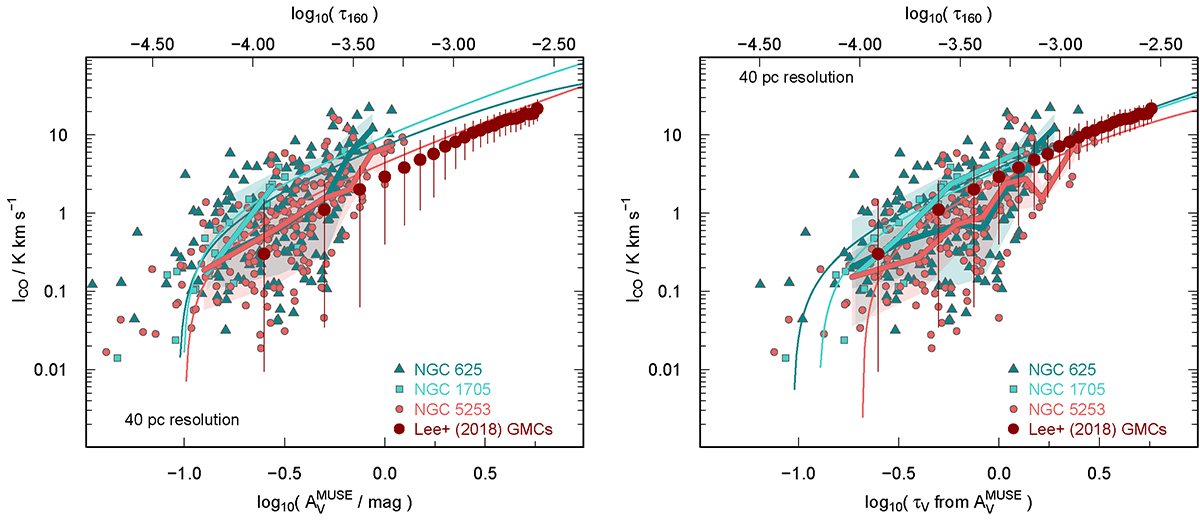
CO velocity-integrated TBICO plotted versus (logarithm) visual extinction AV (left panel) and (logarithm) visual dust optical depth τV (right). The top axes show the scale for τ160 assuming that AV/τ160 = 2180, as described in Sect. 5.3. The light curves show fits to Eq. (12). Heavy curves show the medians for each galaxy binned in log10(AV), (left), log10(τV), (right), with the shaded regions corresponding to ±1σ deviations. Also shown in both panels are the MW GMCs studied by Lee et al. (2018), with AV inferred from Planck; see Sect. 5 for more details.
Current usage metrics show cumulative count of Article Views (full-text article views including HTML views, PDF and ePub downloads, according to the available data) and Abstracts Views on Vision4Press platform.
Data correspond to usage on the plateform after 2015. The current usage metrics is available 48-96 hours after online publication and is updated daily on week days.
Initial download of the metrics may take a while.