Fig. 10.
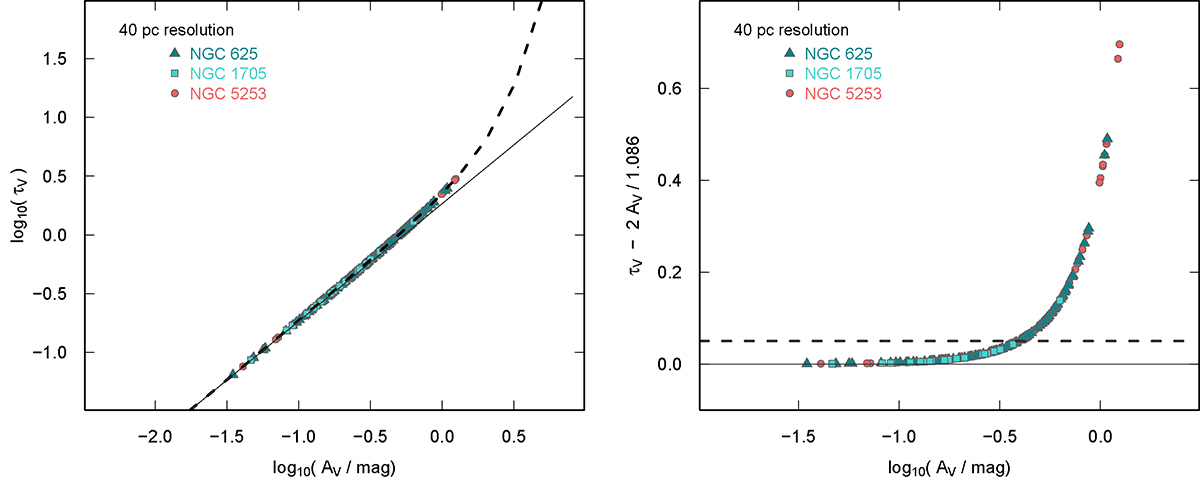
Download original image
Relations between AV and τV. Left panel: τV inferred from Eq. (11) for the targets plotted against log10(![]() ). The heavy dashed curve shows the true solution, and the lighter weight solid curve shows not identity, but rather y = log10(τV) = x − log10(1.086)+log10(2), where x = log10(
). The heavy dashed curve shows the true solution, and the lighter weight solid curve shows not identity, but rather y = log10(τV) = x − log10(1.086)+log10(2), where x = log10(![]() ). The factor of 2 takes into account that
). The factor of 2 takes into account that ![]() only probes the extinction along the line of sight, i.e., the front of the foreground screen, and the other factor is from Eq. (9). The difference of the two quantities τV and
only probes the extinction along the line of sight, i.e., the front of the foreground screen, and the other factor is from Eq. (9). The difference of the two quantities τV and ![]() is negligible at low τV, but becomes significant for
is negligible at low τV, but becomes significant for ![]() ≳0.3 − 0.5 mag. At
≳0.3 − 0.5 mag. At ![]() > 1 mag, τV “runs” away, relative to AV. Right panel: Residuals of τV − 2
> 1 mag, τV “runs” away, relative to AV. Right panel: Residuals of τV − 2 ![]() /1.086 versus log(AV). Although difficult to appreciate in the left panel, 34% of the data points have residuals > 0.05, marked by the horizontal dashed line.
/1.086 versus log(AV). Although difficult to appreciate in the left panel, 34% of the data points have residuals > 0.05, marked by the horizontal dashed line.
Current usage metrics show cumulative count of Article Views (full-text article views including HTML views, PDF and ePub downloads, according to the available data) and Abstracts Views on Vision4Press platform.
Data correspond to usage on the plateform after 2015. The current usage metrics is available 48-96 hours after online publication and is updated daily on week days.
Initial download of the metrics may take a while.