Fig. 4
Download original image
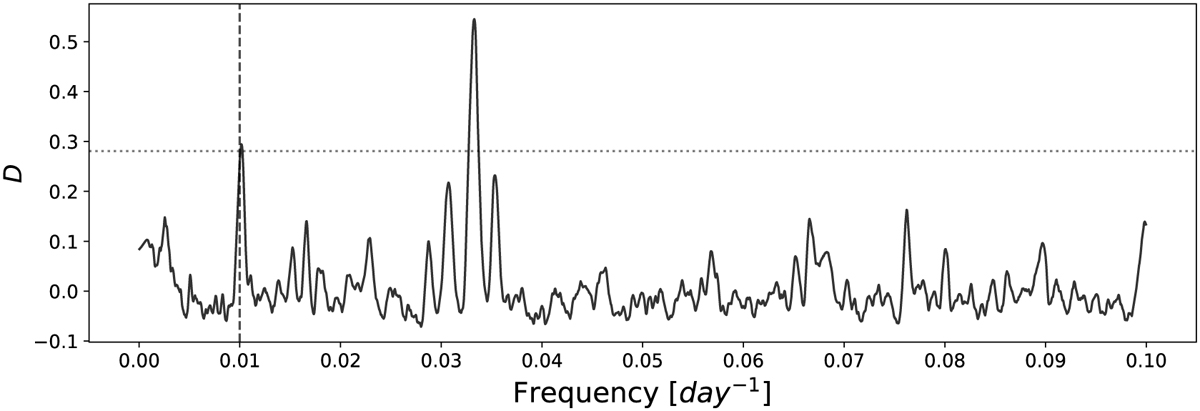
Astrometric PDC periodograms for a simulated system with a 100-day orbital period and a 60-day satellite rotation period. The dashed vertical line marks the simulated orbital frequency, and the dotted horizontal line corresponds to an FAP level of 10−3. An additional peak matching the period of ~30 days appears in the periodogram, and it is probably related to half the satellite rotation period.
Current usage metrics show cumulative count of Article Views (full-text article views including HTML views, PDF and ePub downloads, according to the available data) and Abstracts Views on Vision4Press platform.
Data correspond to usage on the plateform after 2015. The current usage metrics is available 48-96 hours after online publication and is updated daily on week days.
Initial download of the metrics may take a while.