Fig. 7
Download original image
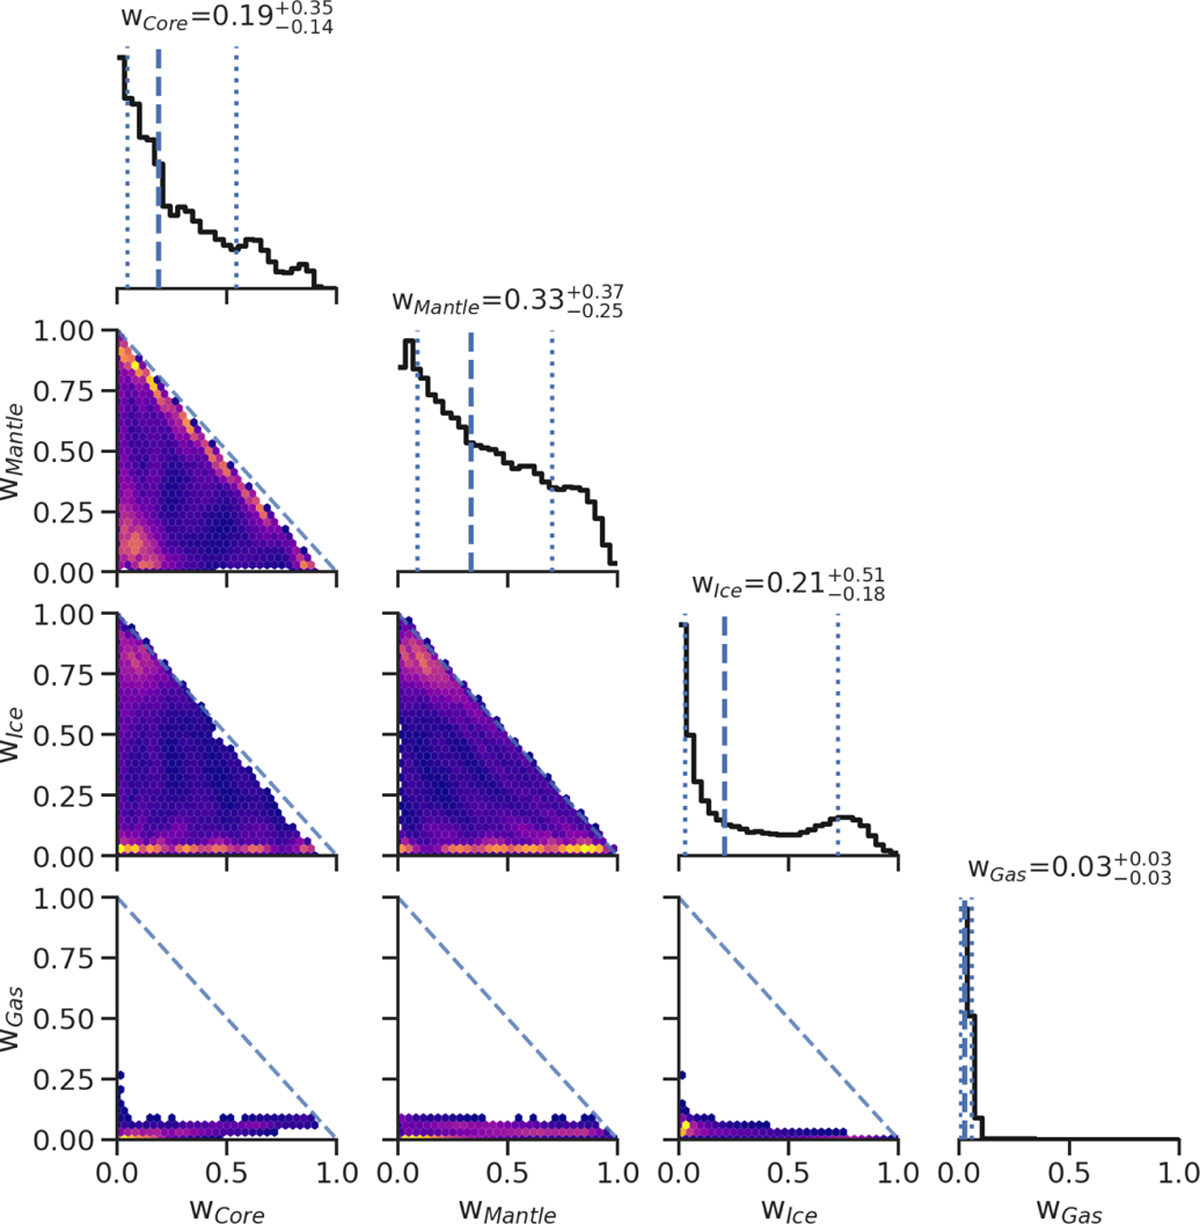
Distributions resulting from the internal structure modeling following Baumeister et al. (2020). The values above the histograms are the median and the 16th and 84th percentiles of the posterior distribution (same as the dashed lines). The plotted internal structure parameters are: the radius fraction of the core, mantle, ice (of water), and gas layers.
Current usage metrics show cumulative count of Article Views (full-text article views including HTML views, PDF and ePub downloads, according to the available data) and Abstracts Views on Vision4Press platform.
Data correspond to usage on the plateform after 2015. The current usage metrics is available 48-96 hours after online publication and is updated daily on week days.
Initial download of the metrics may take a while.