Fig. 11
Download original image
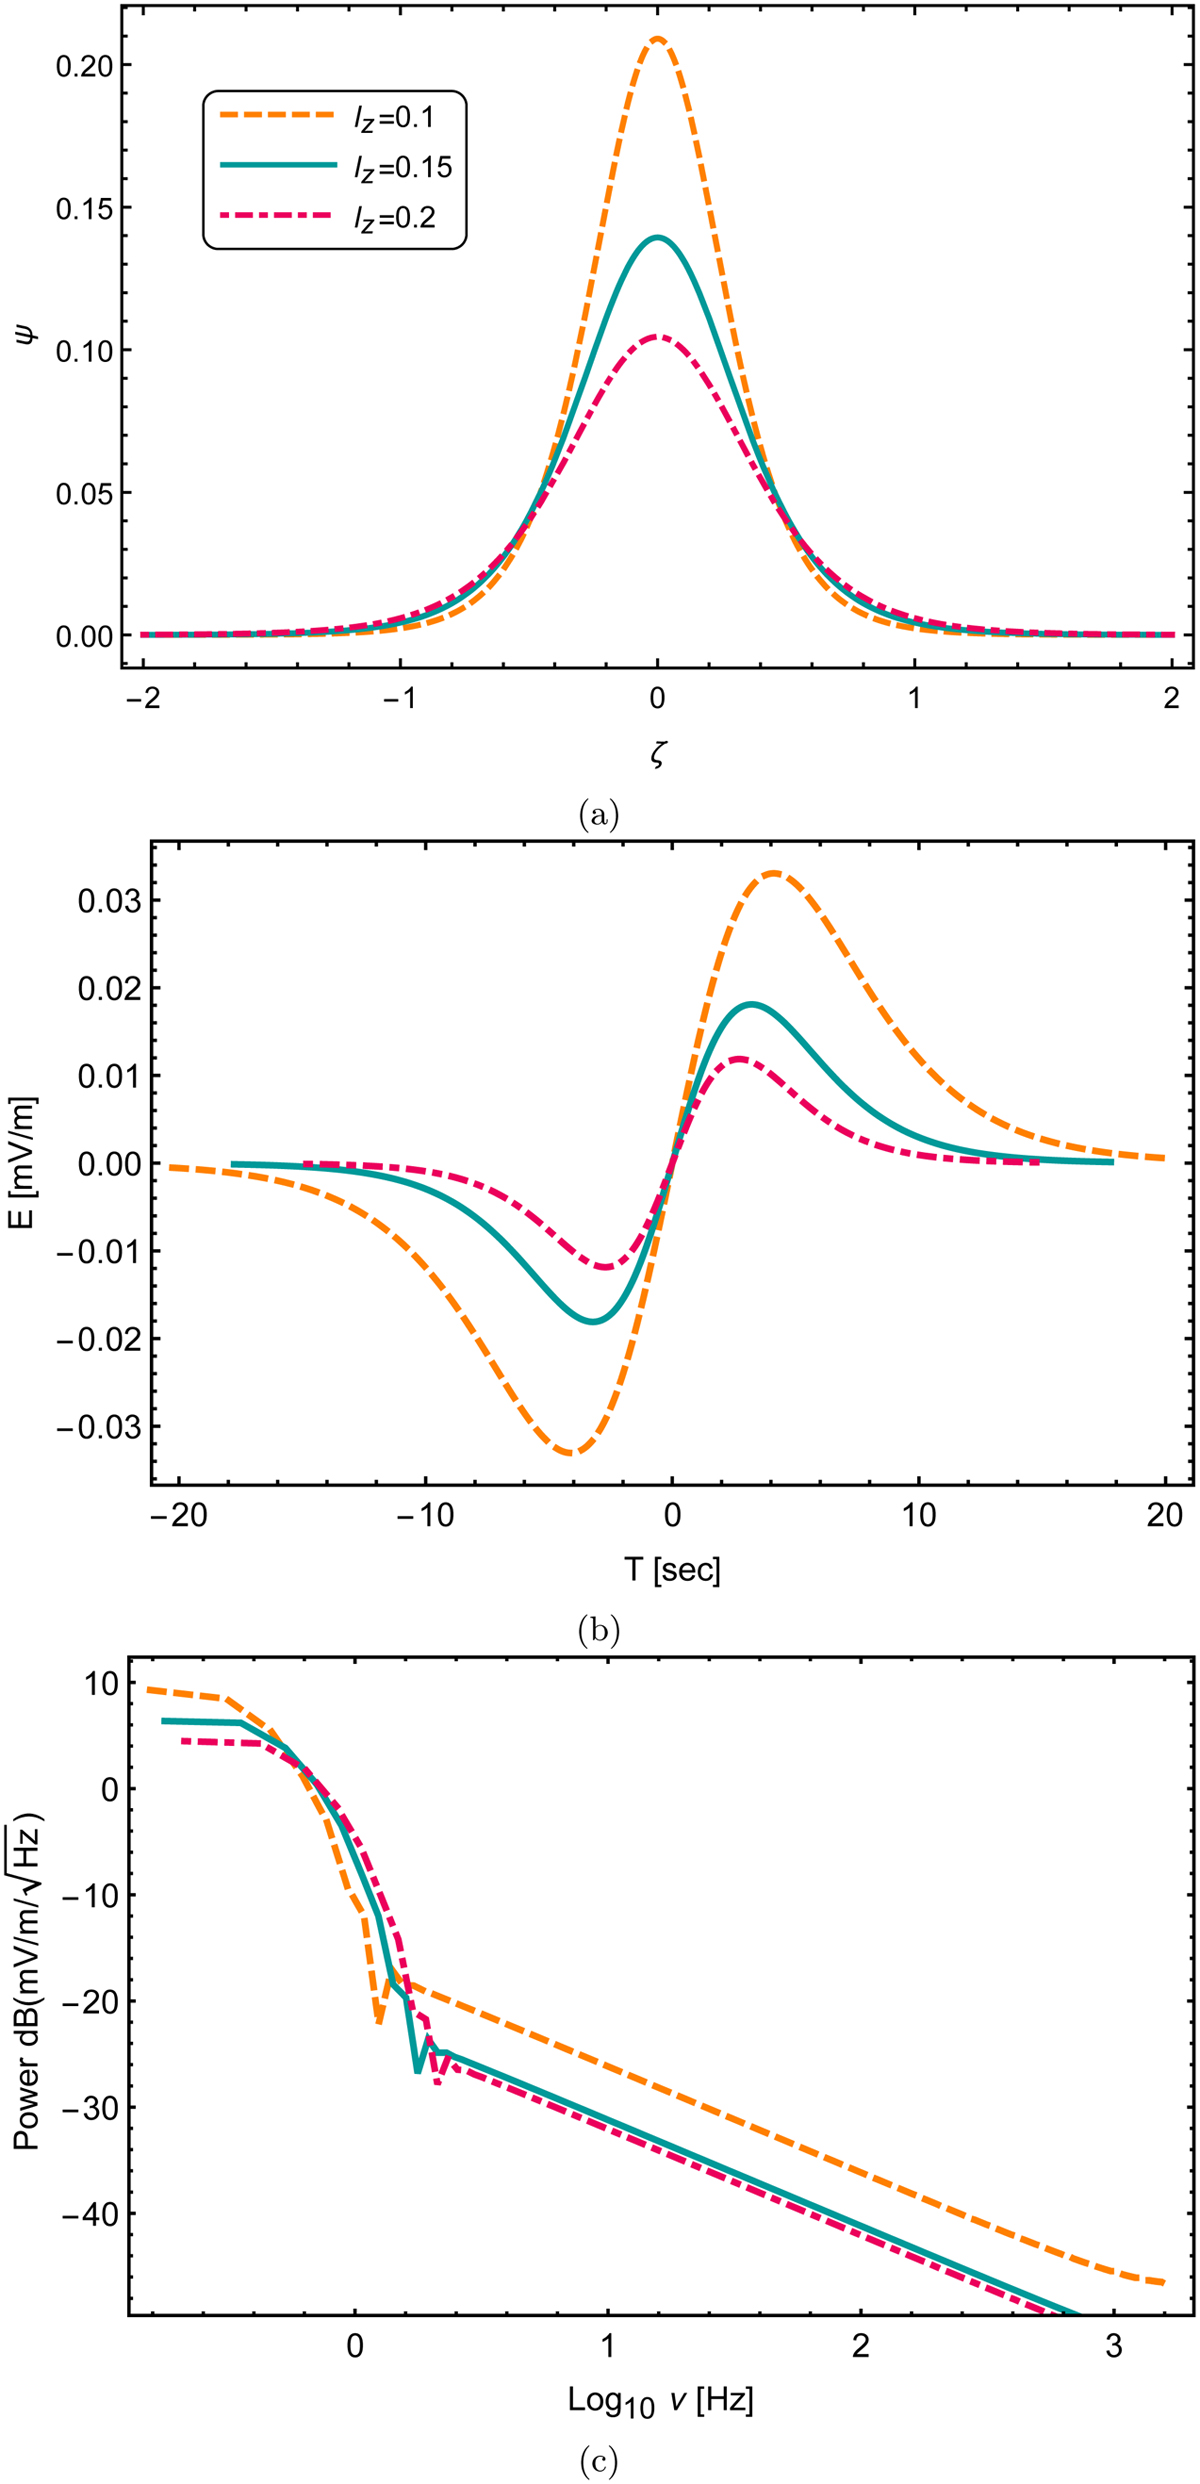
Solitary wave profile with its corresponding electric field and FFT power spectra. (a) Solitary profiles versus ζ. (b) Corresponding bipolar electric field for different values of lz where lz = 0.1 (dashed orange), lz = 0.15 (mint green), and lz = 0.2 (dot-dashed pink). (c) Corresponding FFT power spectra of the electric fields. The x-axis represents the log10 v where v is the frequency in Hz and the y-axis resembles the power of the electric field expressed in units of decibels db(![]() ) with frequency peaks at fp = 0.155 Hz (dashed orange), fp = 0.177 Hz (mint green), and fp = 0.212 Hz (dot-dashed pink).
) with frequency peaks at fp = 0.155 Hz (dashed orange), fp = 0.177 Hz (mint green), and fp = 0.212 Hz (dot-dashed pink).
Current usage metrics show cumulative count of Article Views (full-text article views including HTML views, PDF and ePub downloads, according to the available data) and Abstracts Views on Vision4Press platform.
Data correspond to usage on the plateform after 2015. The current usage metrics is available 48-96 hours after online publication and is updated daily on week days.
Initial download of the metrics may take a while.