Fig. 8.
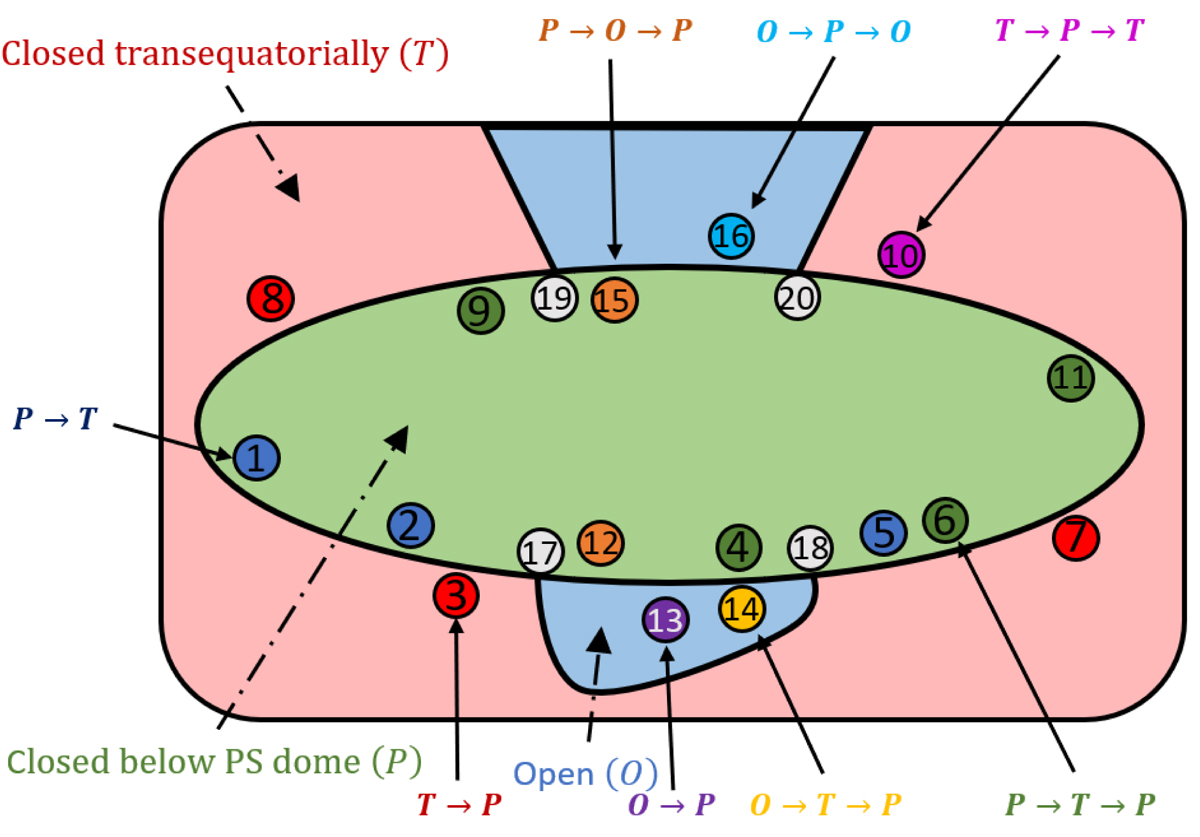
Download original image
Cartoon of the connectivity map at t = 0 summarizing the connectivity evolution of particular magnetic field lines during the forcing stage. The colors of the map behind the points represent all three connectivity domains at t = 0: green for magnetic field closed below the PS dome (P), blue for open field (O), and red for trans-equatorial closed field (T). The size of the equatorial coronal hole is voluntary magnified, for readability reasons. The fixed footpoints of the selected field lines are represented by circles whose color are the same as used in Fig. 9 and Figs. 10–12. The colors correspond to particular connectivity evolution detailed in Sects. 3.4–3.6, depending on the connectivity states that a given field line has among P, T, and O states. For example T → P means the field line was a trans-equatorial loop before the reconnection and a pseudo-streamer loop after the reconnection.
Current usage metrics show cumulative count of Article Views (full-text article views including HTML views, PDF and ePub downloads, according to the available data) and Abstracts Views on Vision4Press platform.
Data correspond to usage on the plateform after 2015. The current usage metrics is available 48-96 hours after online publication and is updated daily on week days.
Initial download of the metrics may take a while.