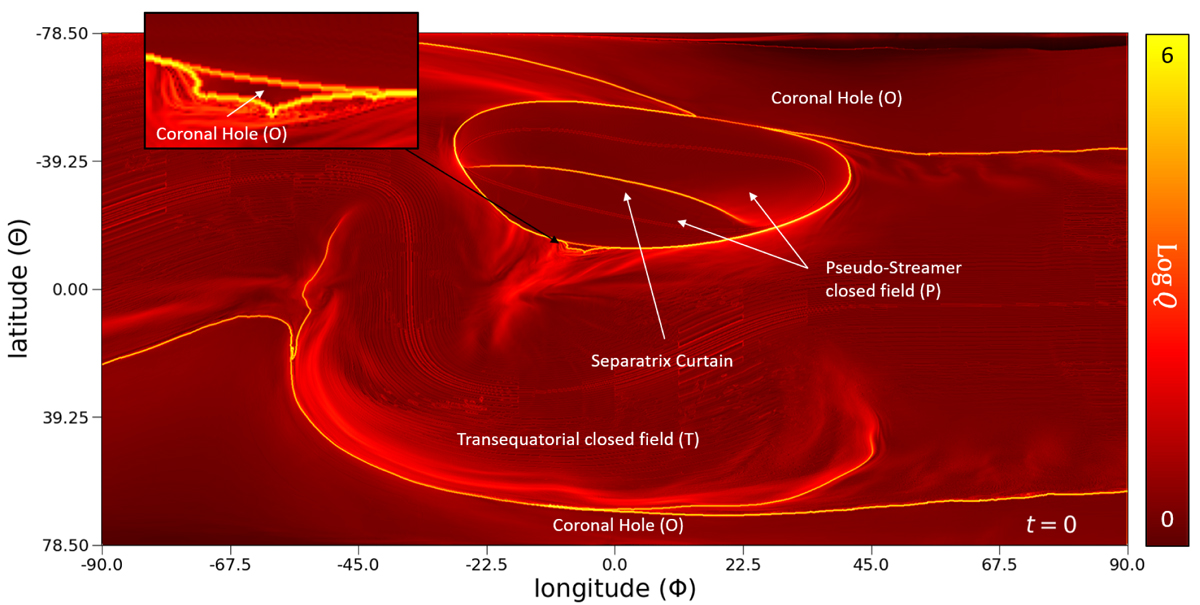
Fig. 3.
Download original image
Distribution of log Q after the relaxation. The yellow-colored separatrices delineate the connectivity domains: trans-equatorial streamer loops, pseudo-streamer loops (both closed field), and polar and equatorial coronal holes (open field). The size of the equatorial coronal hole (see inserted panel) is significantly reduced during the relaxation.
Current usage metrics show cumulative count of Article Views (full-text article views including HTML views, PDF and ePub downloads, according to the available data) and Abstracts Views on Vision4Press platform.
Data correspond to usage on the plateform after 2015. The current usage metrics is available 48-96 hours after online publication and is updated daily on week days.
Initial download of the metrics may take a while.