Fig. 14.
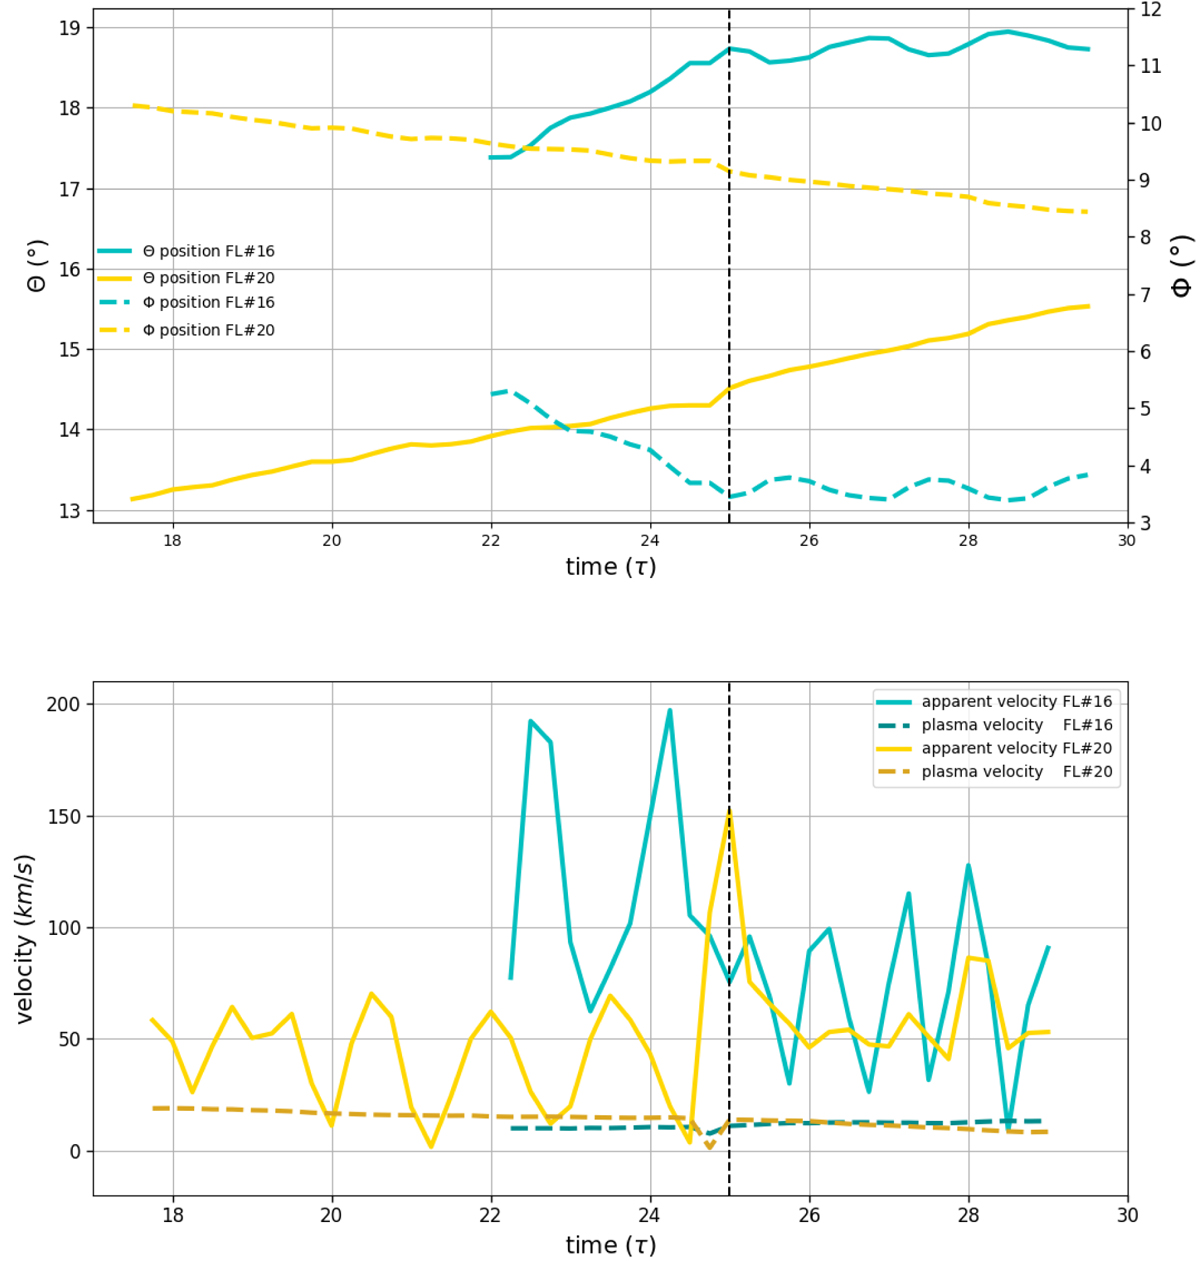
Download original image
Evolution of the Θ (latitude, solid line) and Φ (longitude, dashed line) components of the field lines n° 16 (cyan) and 20 (yellow) at 2 R⊙ (top). Tangential velocity of the field lines n° 16 (cyan) and 20 (yellow) calculated at 2 R⊙ between t = 17.75 τ and t = 29.25 τ (bottom). The cyan and yellow dashed lines display the tangential plasma velocities at 2 R⊙ at the location of the footpoints of the associated field lines. The vertical dashed back line indicates the end of the large, rather straight slipping motion for the cyan field line (n° 16) and the beginning of the oscillations.
Current usage metrics show cumulative count of Article Views (full-text article views including HTML views, PDF and ePub downloads, according to the available data) and Abstracts Views on Vision4Press platform.
Data correspond to usage on the plateform after 2015. The current usage metrics is available 48-96 hours after online publication and is updated daily on week days.
Initial download of the metrics may take a while.