Fig. 1.
Download original image
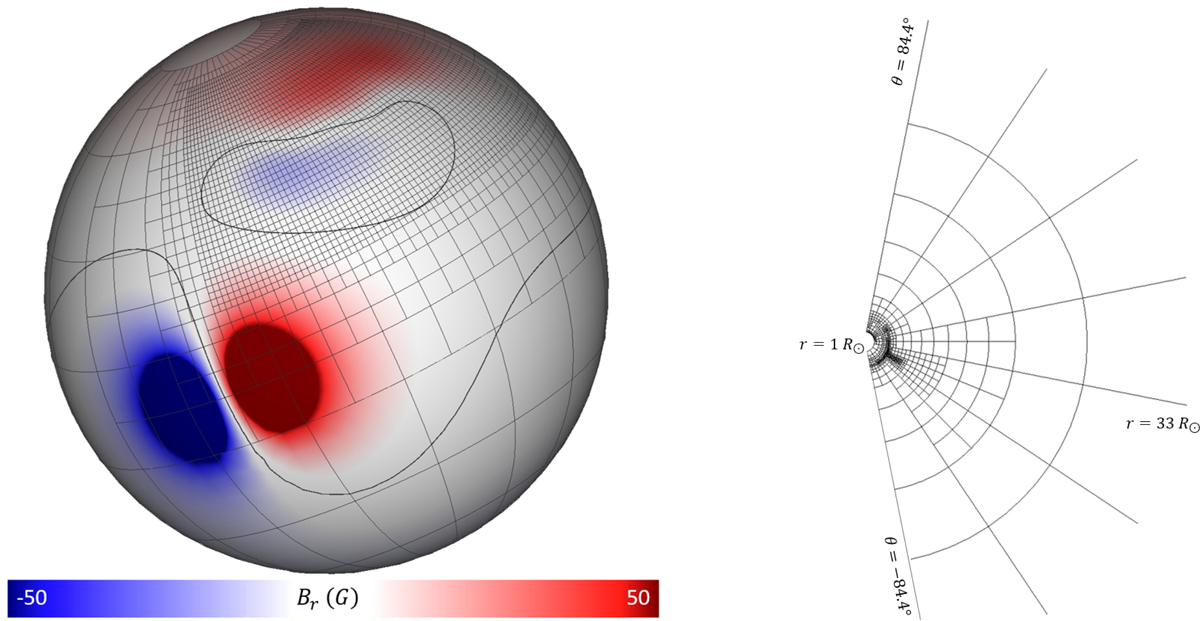
Radial magnetic field distribution on the solar surface with a strong dipole at the equator and four weaker dipoles at higher latitudes in the northern hemisphere (left). The two thick black lines represent the equatorial and parasitic dipole polarity inversion lines. Longitudinal 2D Sections of the grid at Φ = −175° and 5° after the relaxation (right). For more details, see Sect. 2.4. In both panels, the simulation grid is represented with thin black lines.
Current usage metrics show cumulative count of Article Views (full-text article views including HTML views, PDF and ePub downloads, according to the available data) and Abstracts Views on Vision4Press platform.
Data correspond to usage on the plateform after 2015. The current usage metrics is available 48-96 hours after online publication and is updated daily on week days.
Initial download of the metrics may take a while.