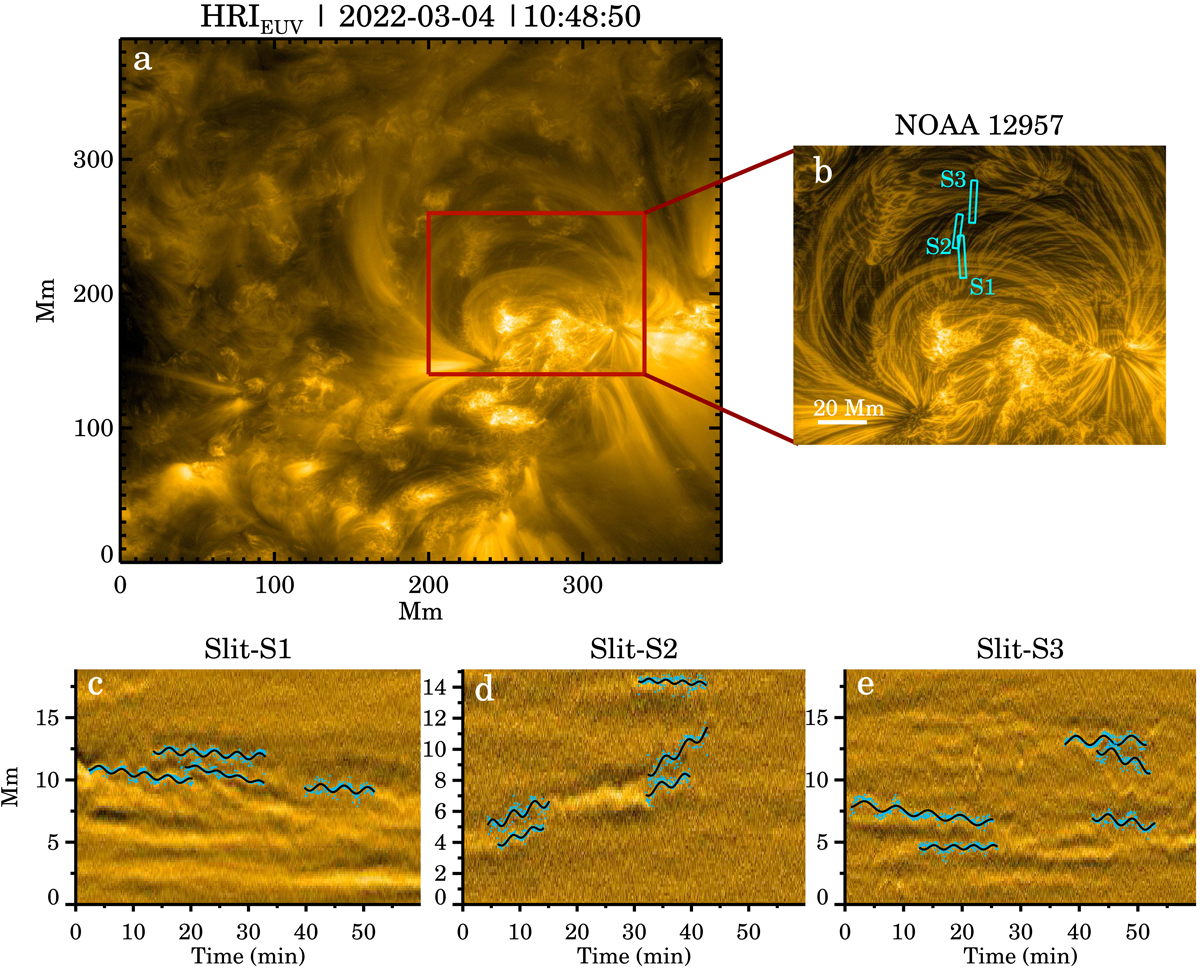
Fig. 4.
Download original image
Example of decayless kink waves observed in AR12957 on 2022 March 04. Panel b shows a magnified image of the loops in panel a. The boxes S1 to S3 indicate the slits along which the temporal evolution is shown in the form of space-time diagrams in panels c to e. To enhance the appearance of the oscillating threads in these space-time diagrams, a smooth version of the map (boxcar-smoothed in the vertical direction) is subtracted from each original map. The black lines represent fits for the oscillation of the loops (see Sect. 3.1.1 for details).
Current usage metrics show cumulative count of Article Views (full-text article views including HTML views, PDF and ePub downloads, according to the available data) and Abstracts Views on Vision4Press platform.
Data correspond to usage on the plateform after 2015. The current usage metrics is available 48-96 hours after online publication and is updated daily on week days.
Initial download of the metrics may take a while.