Fig. 12.
Download original image
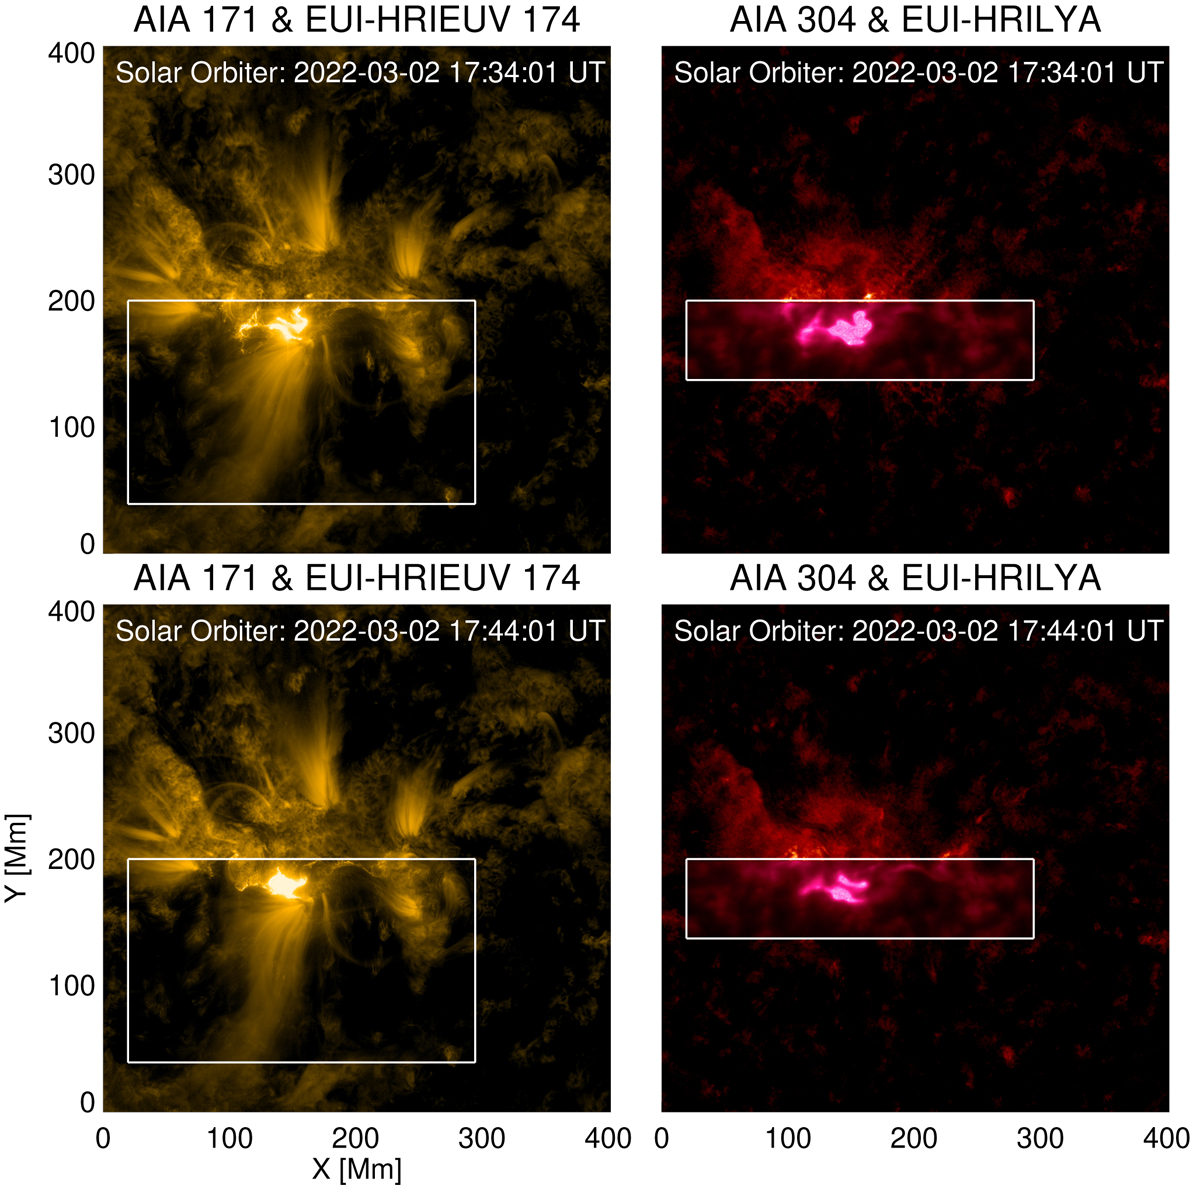
M2 flare on 2022 March 2. Left panels: Combination of AIA 17.1 nm images and HRIEUV 17.4 nm, the latter shown within the white box (only a few seconds apart). Right panels: Same, but for the combination of AIA 30.4 nm and HRILya images. The bottom row is taken 10 min later than the top row images. The white boxes delineate the boundaries of the areas showing data from EUI-HRIs (see Sect. 3.1.9).
Current usage metrics show cumulative count of Article Views (full-text article views including HTML views, PDF and ePub downloads, according to the available data) and Abstracts Views on Vision4Press platform.
Data correspond to usage on the plateform after 2015. The current usage metrics is available 48-96 hours after online publication and is updated daily on week days.
Initial download of the metrics may take a while.