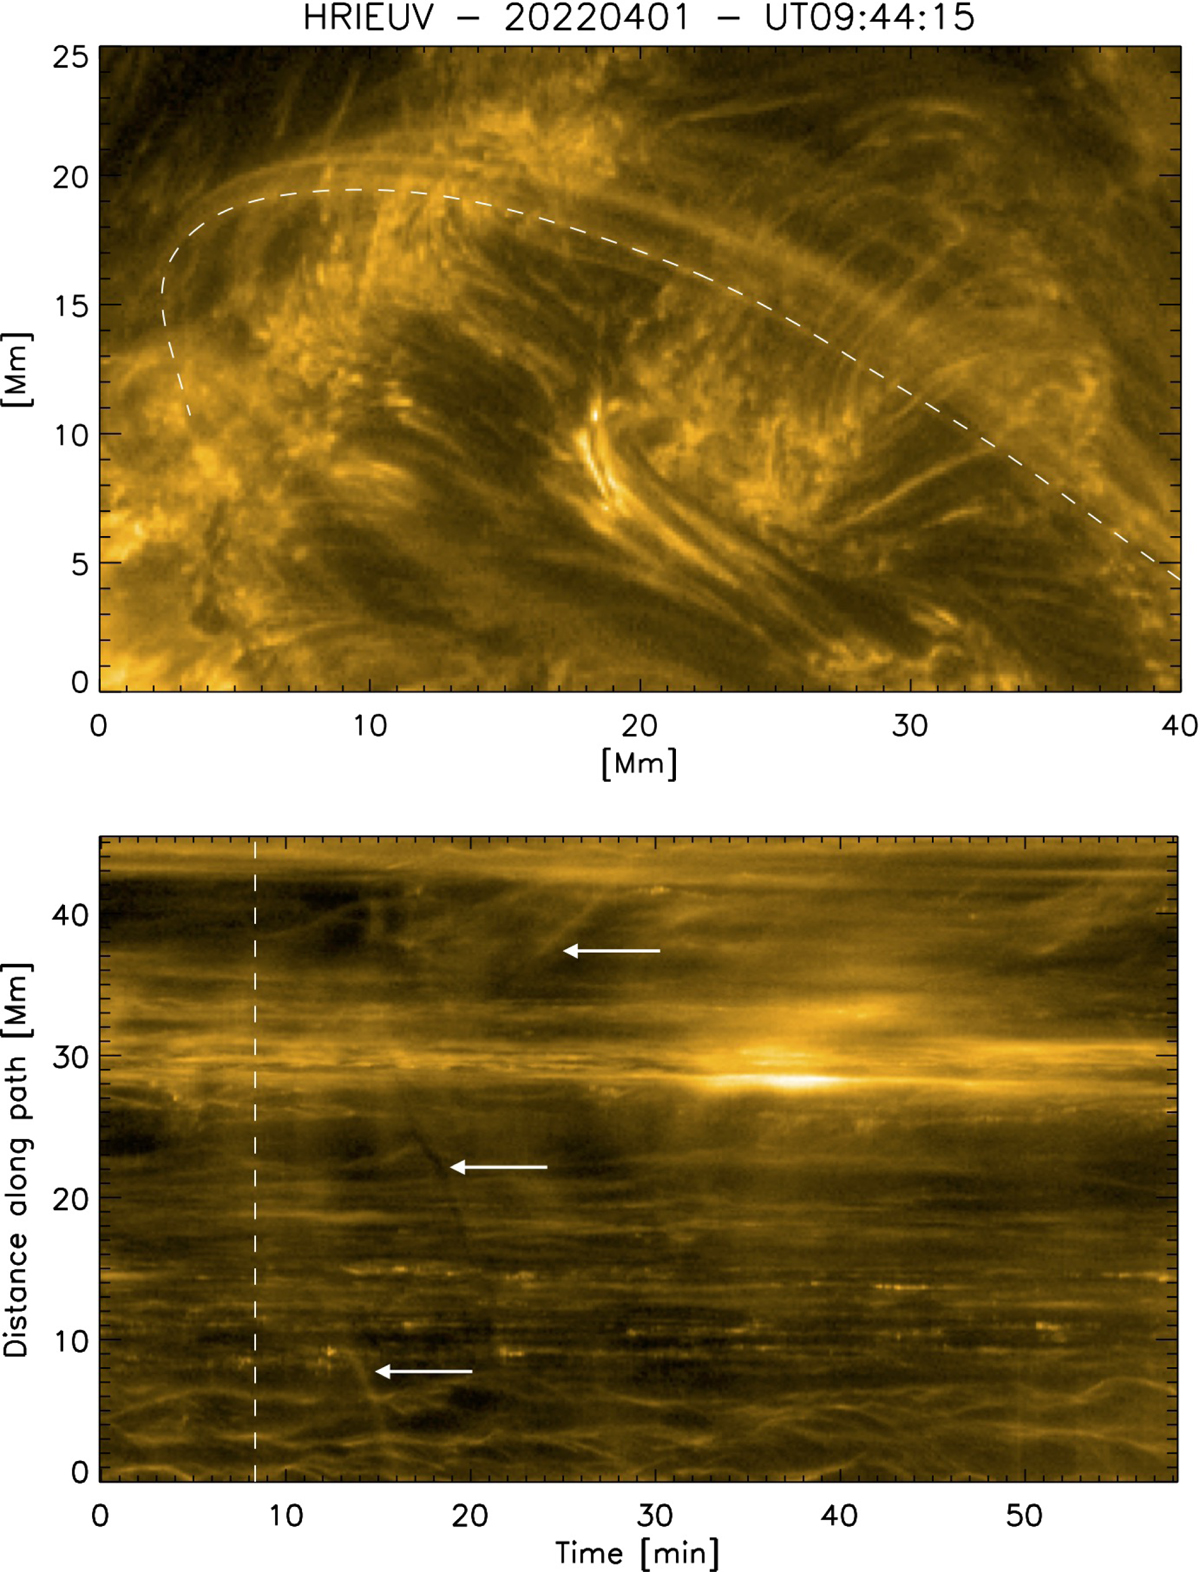
Fig. 11.
Download original image
Coronal strands associated with coronal rain. Top: Subfield of the 2022 April 1 data set observed by HRIEUV (located on the right of Fig. 6a). A loop bundle rooted on moss is seen composed of various strands. The strands appear first near the apex and exhibit bright and dark flows with dynamics characteristic of coronal rain. Bottom: Time–distance plot along one of the observed strands (dashed white curve in top panel). The fuzzy brightening events along the middle of the strand are followed by bright or dark flows toward either footpoint of the strand (indicated by the white arrows). The time of the snapshot in the top panel corresponds to the vertical white dashed line (see Sect. 3.1.8).
Current usage metrics show cumulative count of Article Views (full-text article views including HTML views, PDF and ePub downloads, according to the available data) and Abstracts Views on Vision4Press platform.
Data correspond to usage on the plateform after 2015. The current usage metrics is available 48-96 hours after online publication and is updated daily on week days.
Initial download of the metrics may take a while.