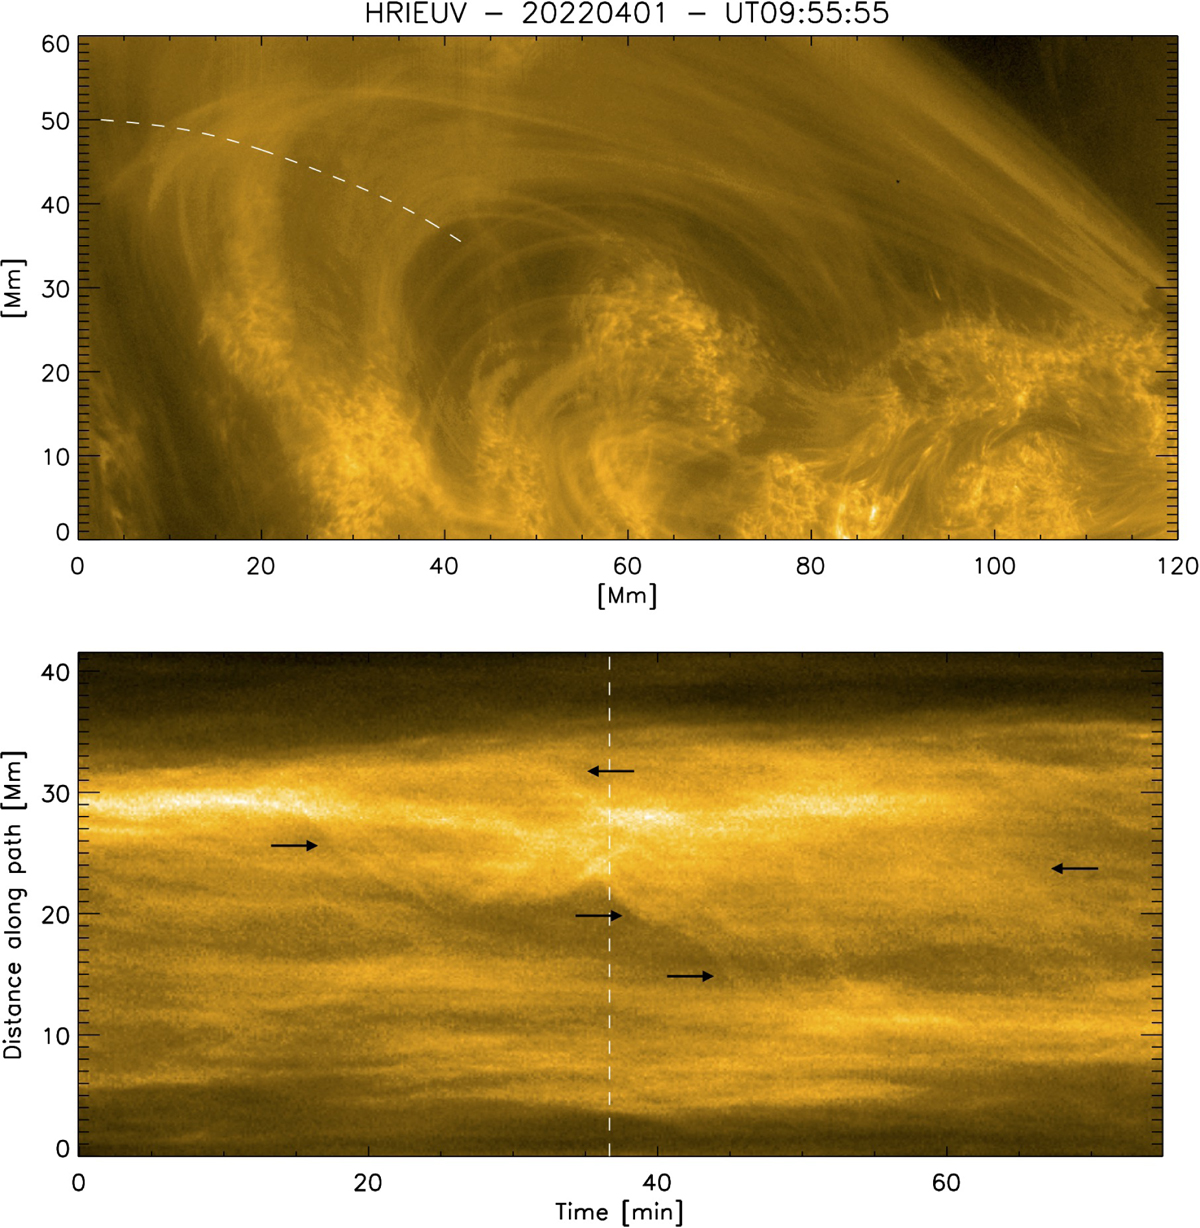
Fig. 10.
Download original image
Reconfiguration of loops substructure. Top: Subfield of the 2022 April 1 data set observed by HRIEUV (located in the bottom right of Fig. 6). A loop bundle is seen (inverted in this figure in order to have the apex on top), where a large-scale reconfiguration is observed. Bottom: Time–distance plot across the apex of the loop (dashed white curve in top panel), revealing a downward (inward) motion of many loops (akin to contraction), indicated by the black arrows, accompanied by transverse oscillations. The time of the snapshot in the top panel corresponds to the vertical white dashed line (see Sect. 3.1.7).
Current usage metrics show cumulative count of Article Views (full-text article views including HTML views, PDF and ePub downloads, according to the available data) and Abstracts Views on Vision4Press platform.
Data correspond to usage on the plateform after 2015. The current usage metrics is available 48-96 hours after online publication and is updated daily on week days.
Initial download of the metrics may take a while.