Open Access
Fig. 6
Download original image
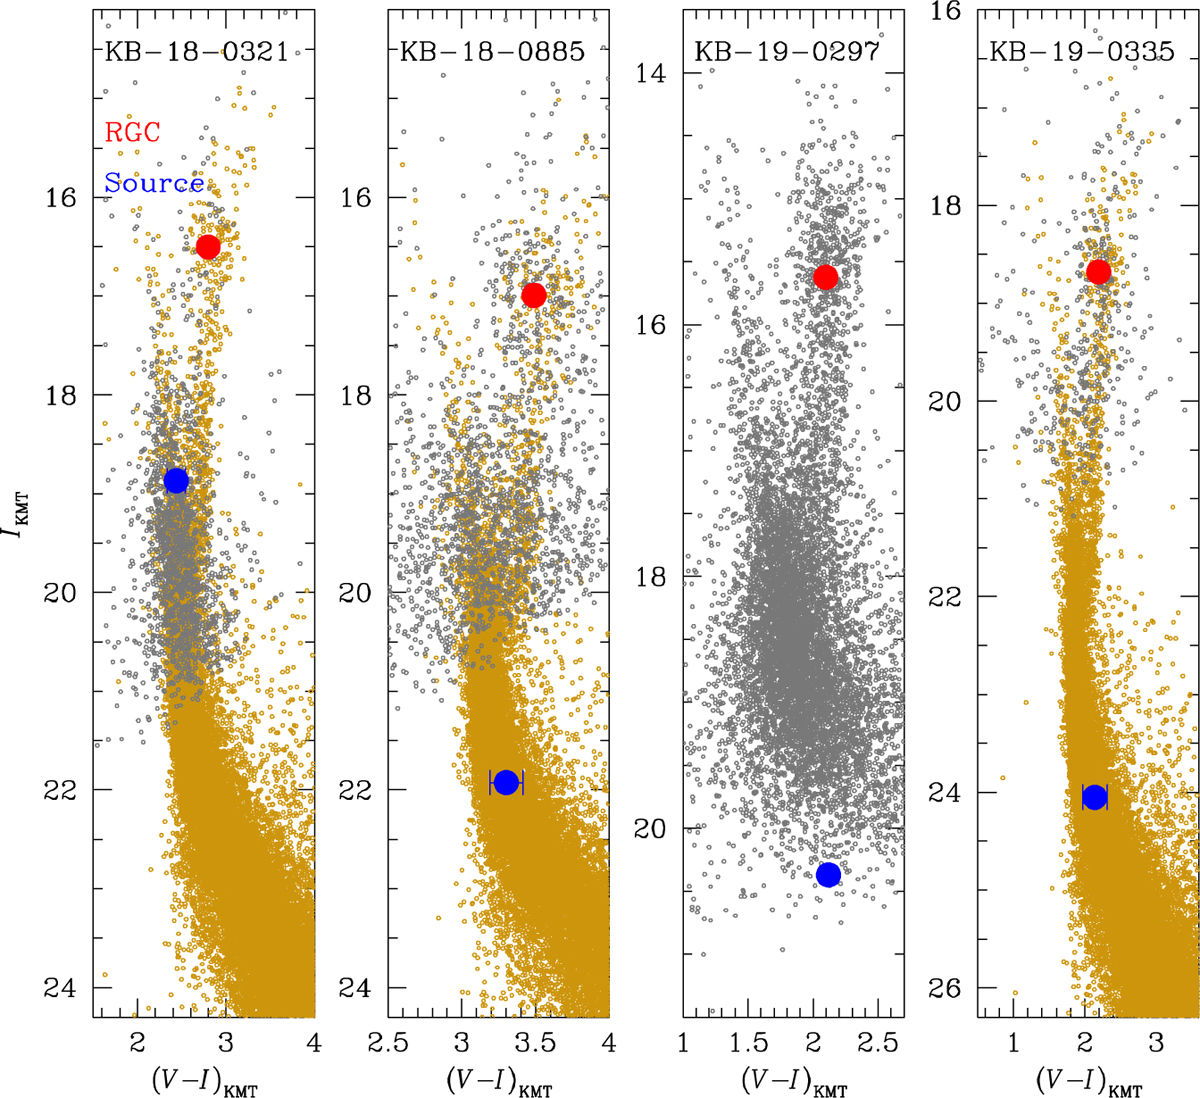
Source locations (blue filled dots) with respect to the centroids of the RGC (red filled dot) in the CMDs. For the three events KMT-2018-BLG-0321, KMT-2018-BLG-0885, and KMT-2019-BLG-0335, the CMDs are constructed by combining those from KMTC (gray dots) and HST (brown dots) observations.
Current usage metrics show cumulative count of Article Views (full-text article views including HTML views, PDF and ePub downloads, according to the available data) and Abstracts Views on Vision4Press platform.
Data correspond to usage on the plateform after 2015. The current usage metrics is available 48-96 hours after online publication and is updated daily on week days.
Initial download of the metrics may take a while.