Fig. 1
Download original image
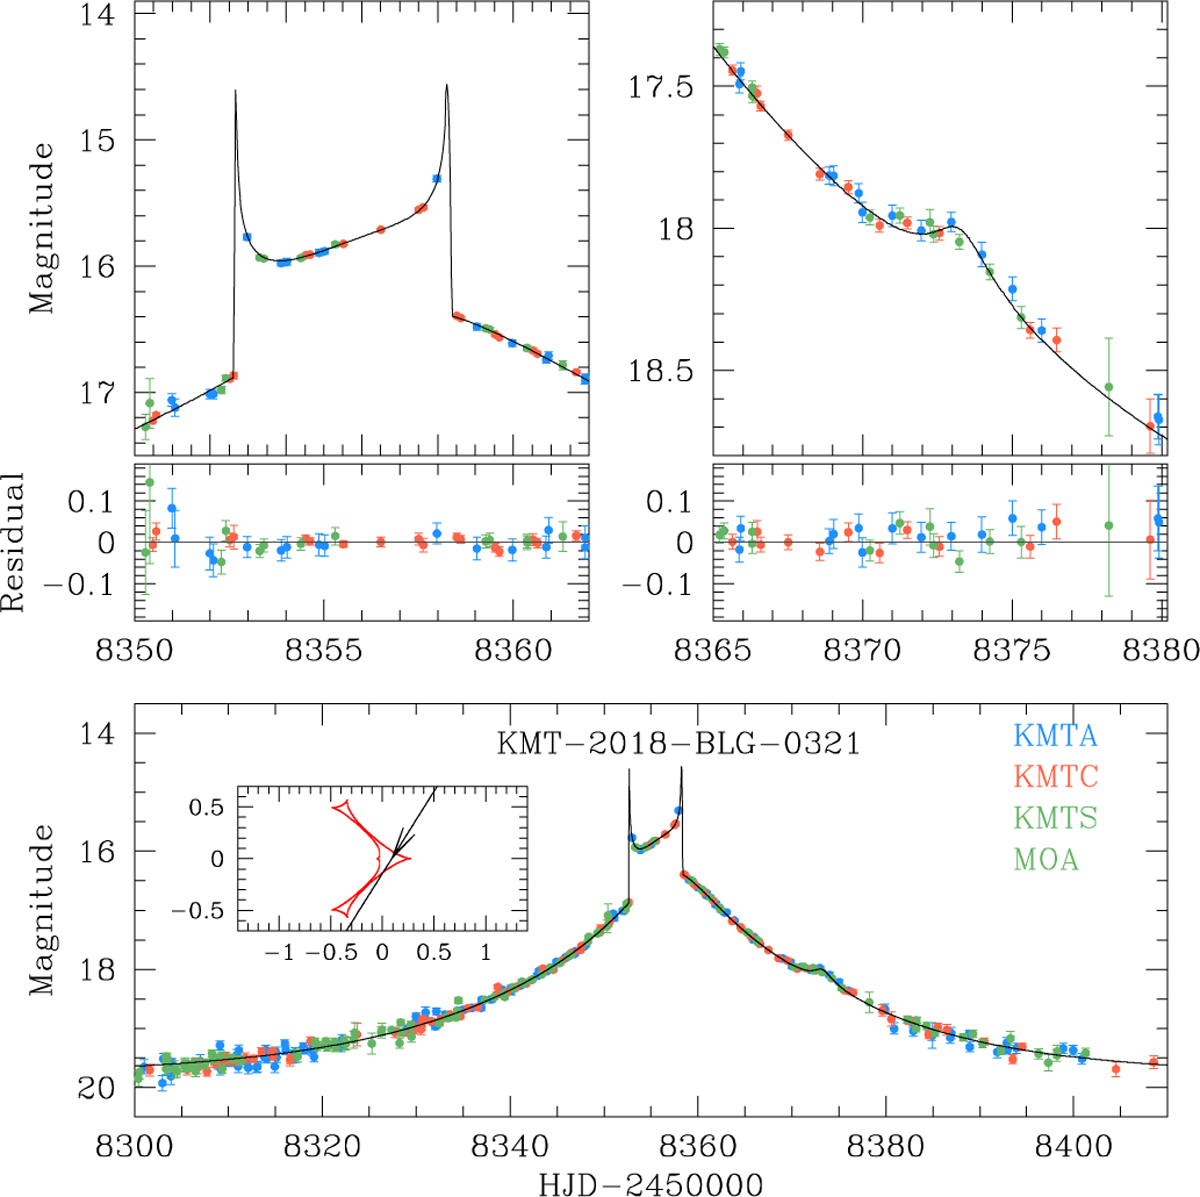
Light curve of KMT-2018-BLG-0321. The lower panel shows the whole view of the light curve and the two upper panels show the enlarged views of the two anomaly regions. The curve drawn over data points is the best-fit 2L1S model. The inset in the lower panel is the lens system configuration, which shows the source trajectory (line with an arrow) with respect to the lens caustic (red figure). Lengths are normalized to the angular Einstein radius corresponding to the total mass of the lens system.
Current usage metrics show cumulative count of Article Views (full-text article views including HTML views, PDF and ePub downloads, according to the available data) and Abstracts Views on Vision4Press platform.
Data correspond to usage on the plateform after 2015. The current usage metrics is available 48-96 hours after online publication and is updated daily on week days.
Initial download of the metrics may take a while.