Fig. 9.
Download original image
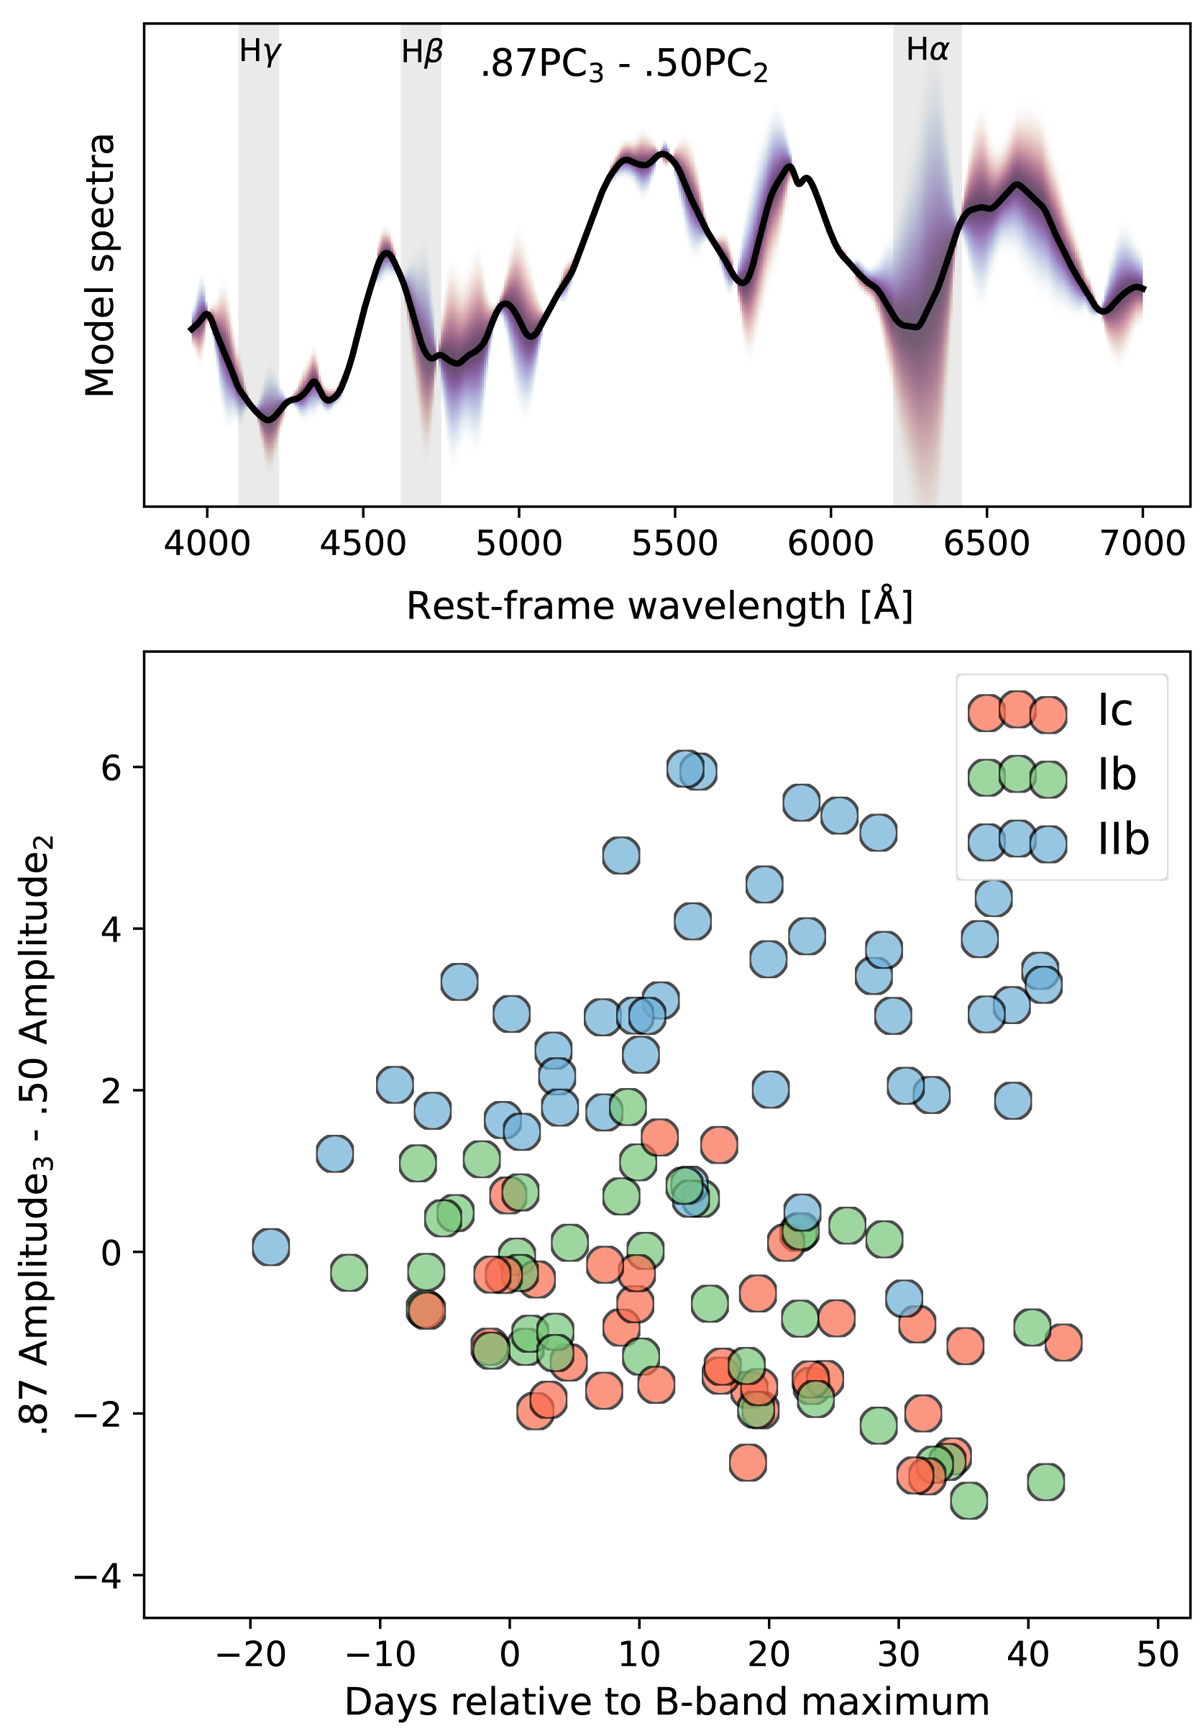
Results from PCA. Top: full range of the linear combination of Amplitude2 and Amplitude3 determined after applying a θ = 30° rotation following Eq. (3). Over-plotted the mean spectrum (black line) determined from all spectra extending to +45 d and covering the wavelength range of 3950–7000 Å. Blue and red shaded regions correspond to the full range of the first rotated PC (0.87 ⋅ Amplitude3 − 0.50 ⋅ Amplitude2) with the blue corresponding negative values and red to positive. Balmer series features are indicated with gray regions as in Fig. 2. Bottom: the corresponding linear combination of Amplitude2 and Amplitude3, plotted versus phase. This particular linear combination separates particularly well between +20 d to +40 d the SNe IIb from the SNe Ib and SNe Ic.
Current usage metrics show cumulative count of Article Views (full-text article views including HTML views, PDF and ePub downloads, according to the available data) and Abstracts Views on Vision4Press platform.
Data correspond to usage on the plateform after 2015. The current usage metrics is available 48-96 hours after online publication and is updated daily on week days.
Initial download of the metrics may take a while.