Fig. 8.
Download original image
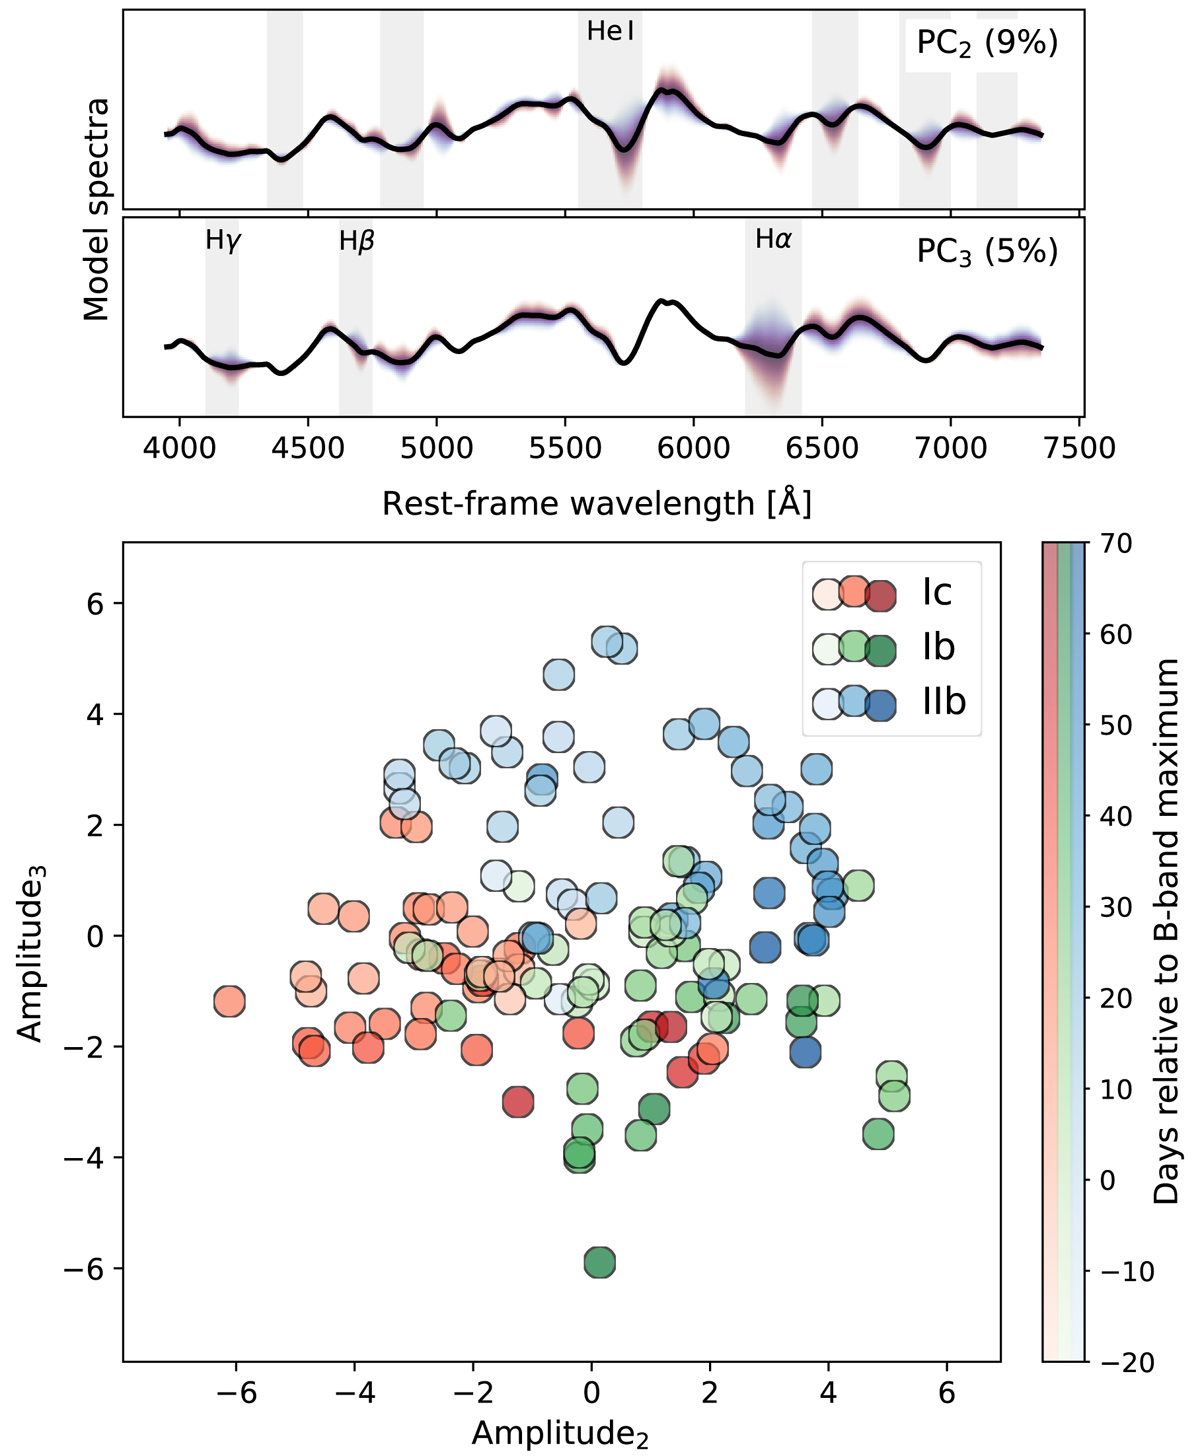
Results from PCA. Top: solid black line is the mean PCA spectrum computing using all observed spectra obtained out to +70 d and covering the wavelength region 3950–7350 Å. Blue and red shaded regions correspond to the full range of Amplitudei with blue (red) corresponding to negative (positive) values. Vertical gray regions correspond to He I (PC2 panel) and H I (PC3 panel) related features (same as in Fig. 2), indicating that variation in PC2 corresponds strongly to Helium and in PC3 to Hydrogen. Bottom: amplitude2 versus Amplitude3, color-coded by spectral subtype with the intensity of colors corresponding to the phase of the observed spectra following the multicolumn colorbar located to the right.
Current usage metrics show cumulative count of Article Views (full-text article views including HTML views, PDF and ePub downloads, according to the available data) and Abstracts Views on Vision4Press platform.
Data correspond to usage on the plateform after 2015. The current usage metrics is available 48-96 hours after online publication and is updated daily on week days.
Initial download of the metrics may take a while.