Fig. 7.
Download original image
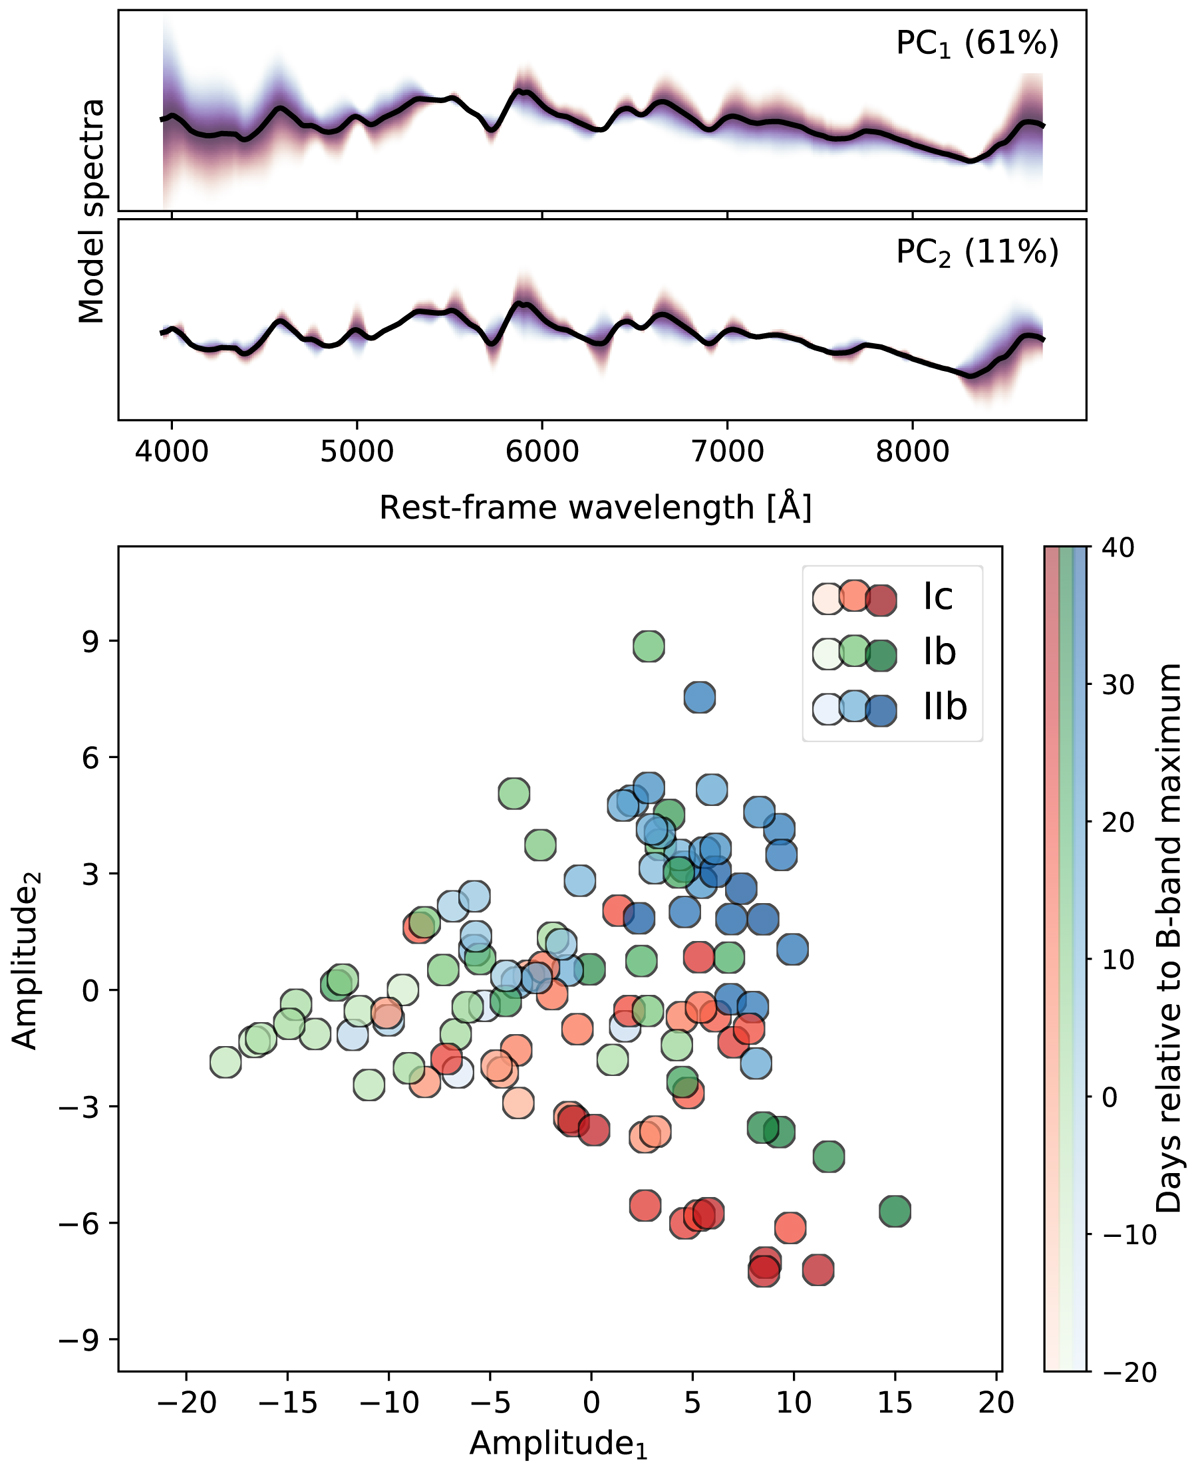
Results from PCA. Top: solid black line is the mean spectrum computed using all observed (i.e., 111) spectra obtained out to +40 d and over the spectral range of 3950–8700 Å. The shaded regions correspond to Mean spectrum + Amplitudei ⋅ PCi, yielding the range of amplitudes shown in the panel below. Here the blue shaded regions correspond to negative values, and the red regions correspond to positive values. Bottom: amplitude1 versus Amplitude2, color-coded by spectral subtype and with the intensity of colors corresponding to the phase of the observed spectra following the multicolumn colorbar located to the right.
Current usage metrics show cumulative count of Article Views (full-text article views including HTML views, PDF and ePub downloads, according to the available data) and Abstracts Views on Vision4Press platform.
Data correspond to usage on the plateform after 2015. The current usage metrics is available 48-96 hours after online publication and is updated daily on week days.
Initial download of the metrics may take a while.