Fig. 6.
Download original image
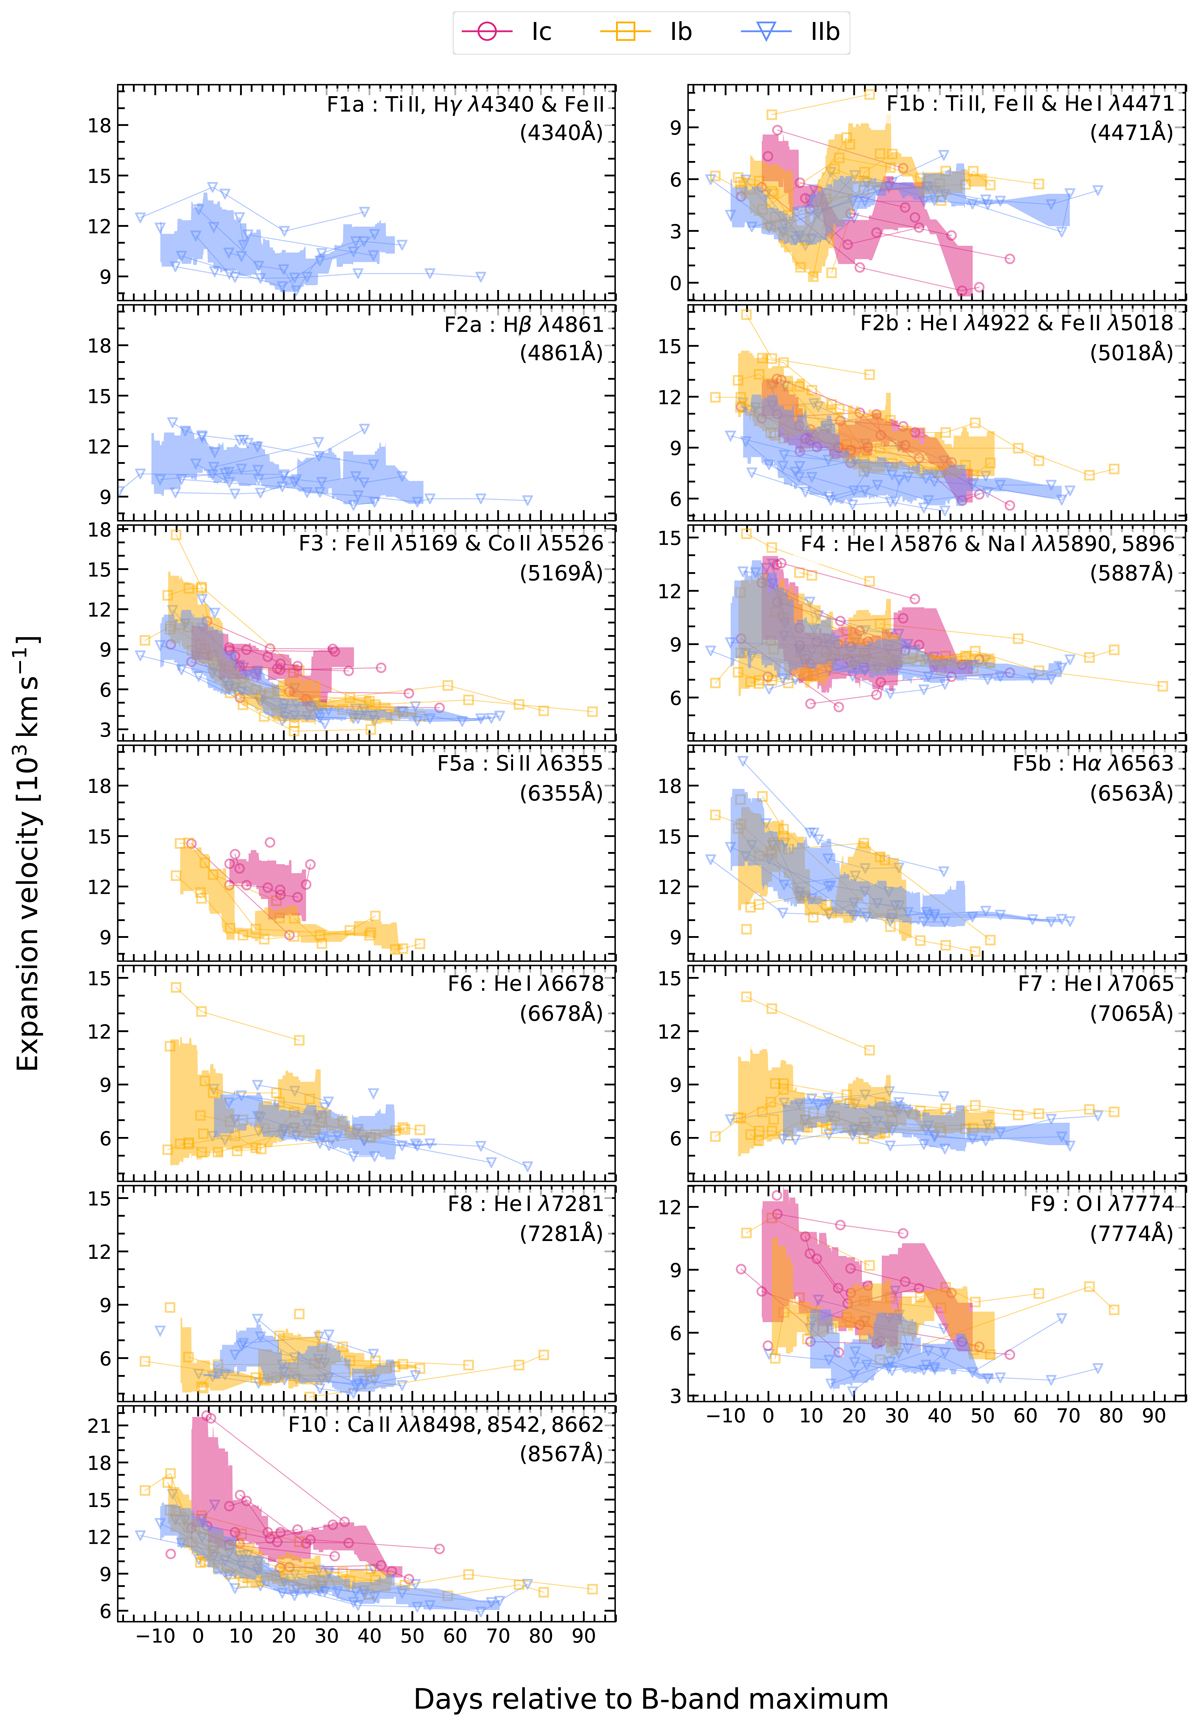
Time evolution of the Doppler velocity at maximum absorption (−vabs) for Features 1–10 and color-coded by SE SN subtype. Shaded regions correspond to the standard deviation of the rolling mean computed using a window size of ten days and color-coded by spectroscopic subtype as indicated. The rolling windows are evaluated on epochs having a minimum of three measurements and at least two measurements before and after. We note that the peculiar SNe Ic 2009bb and 2009ca are excluded.
Current usage metrics show cumulative count of Article Views (full-text article views including HTML views, PDF and ePub downloads, according to the available data) and Abstracts Views on Vision4Press platform.
Data correspond to usage on the plateform after 2015. The current usage metrics is available 48-96 hours after online publication and is updated daily on week days.
Initial download of the metrics may take a while.