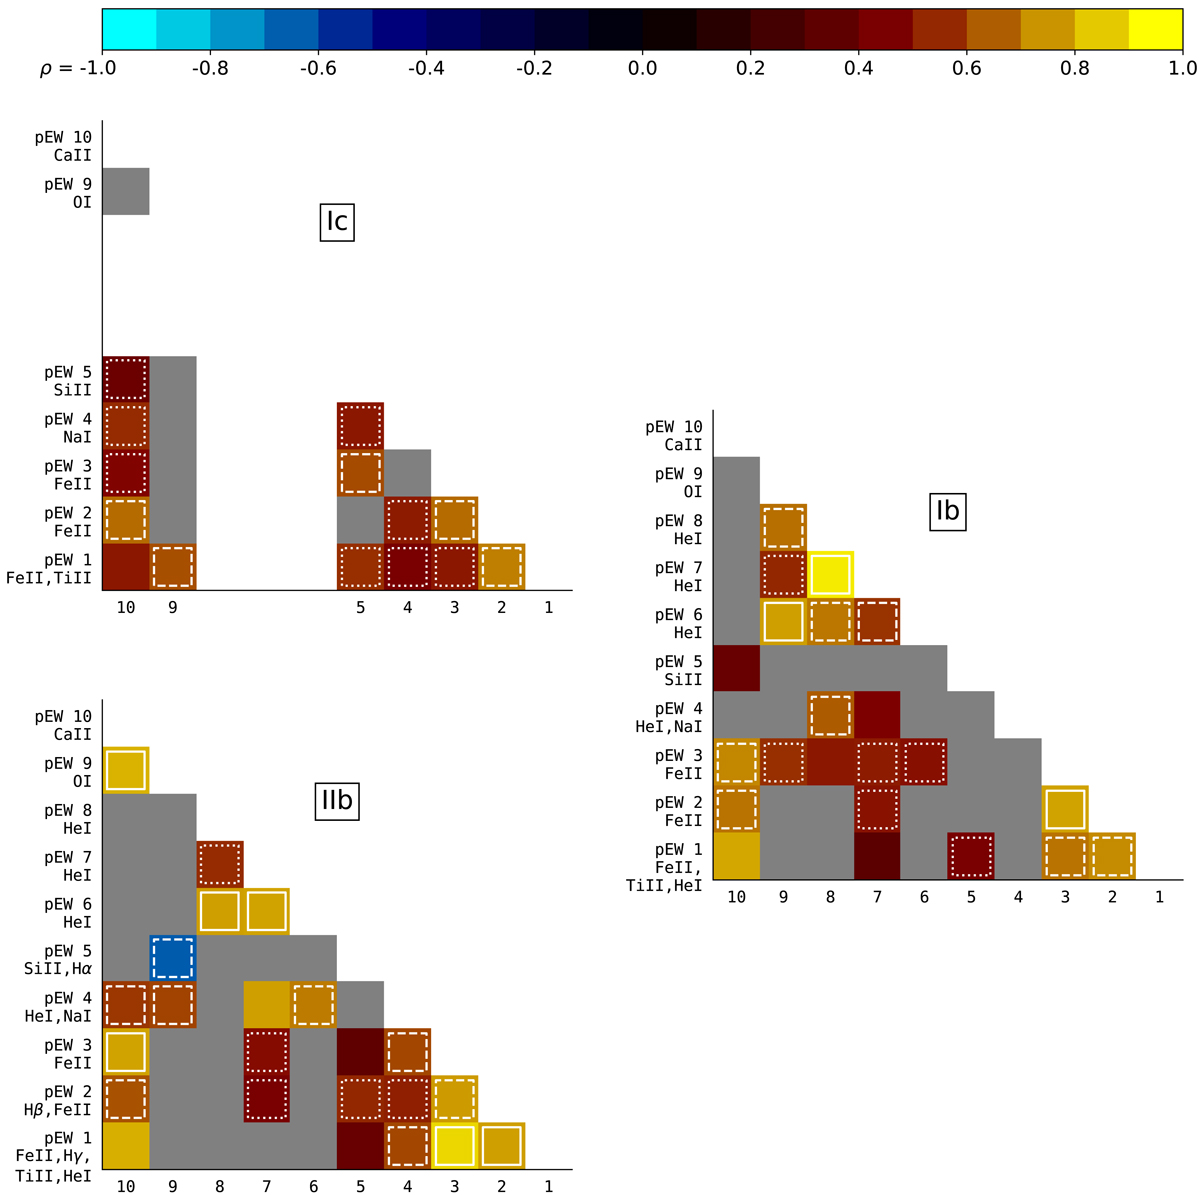
Fig. B.1.
Download original image
Spearman’s rank correlation coefficients (ρ) between pairs of pEW measurements. The colors of the boxes is associated with the correlation coefficient with numeric values indicated by the colorbar at the top of the figure. The lighter the color, the stronger the correlation. Contained within the triangle of each panel are the correlation coefficients between pairs of pEW measurements computed using spectra obtained up to three weeks post the epoch of B-band maximum. The relative significance of ρ for each pair is indicated through the use of white lines. Here white-dotted, white-dashed and white-solid lines correspond to pEW pairs having low (0.4< |ρ| ≤0.6), moderate (0.6< |ρ| ≤0.8), or high (0.8< |ρ|) correlation coefficients, respectively. Colored boxes with no white lines exhibit minimal correlation. Gray squares have low statistical significance and are characterized by probability (p) values p > 0.1.
Current usage metrics show cumulative count of Article Views (full-text article views including HTML views, PDF and ePub downloads, according to the available data) and Abstracts Views on Vision4Press platform.
Data correspond to usage on the plateform after 2015. The current usage metrics is available 48-96 hours after online publication and is updated daily on week days.
Initial download of the metrics may take a while.