Open Access
Fig. A.2.
Download original image
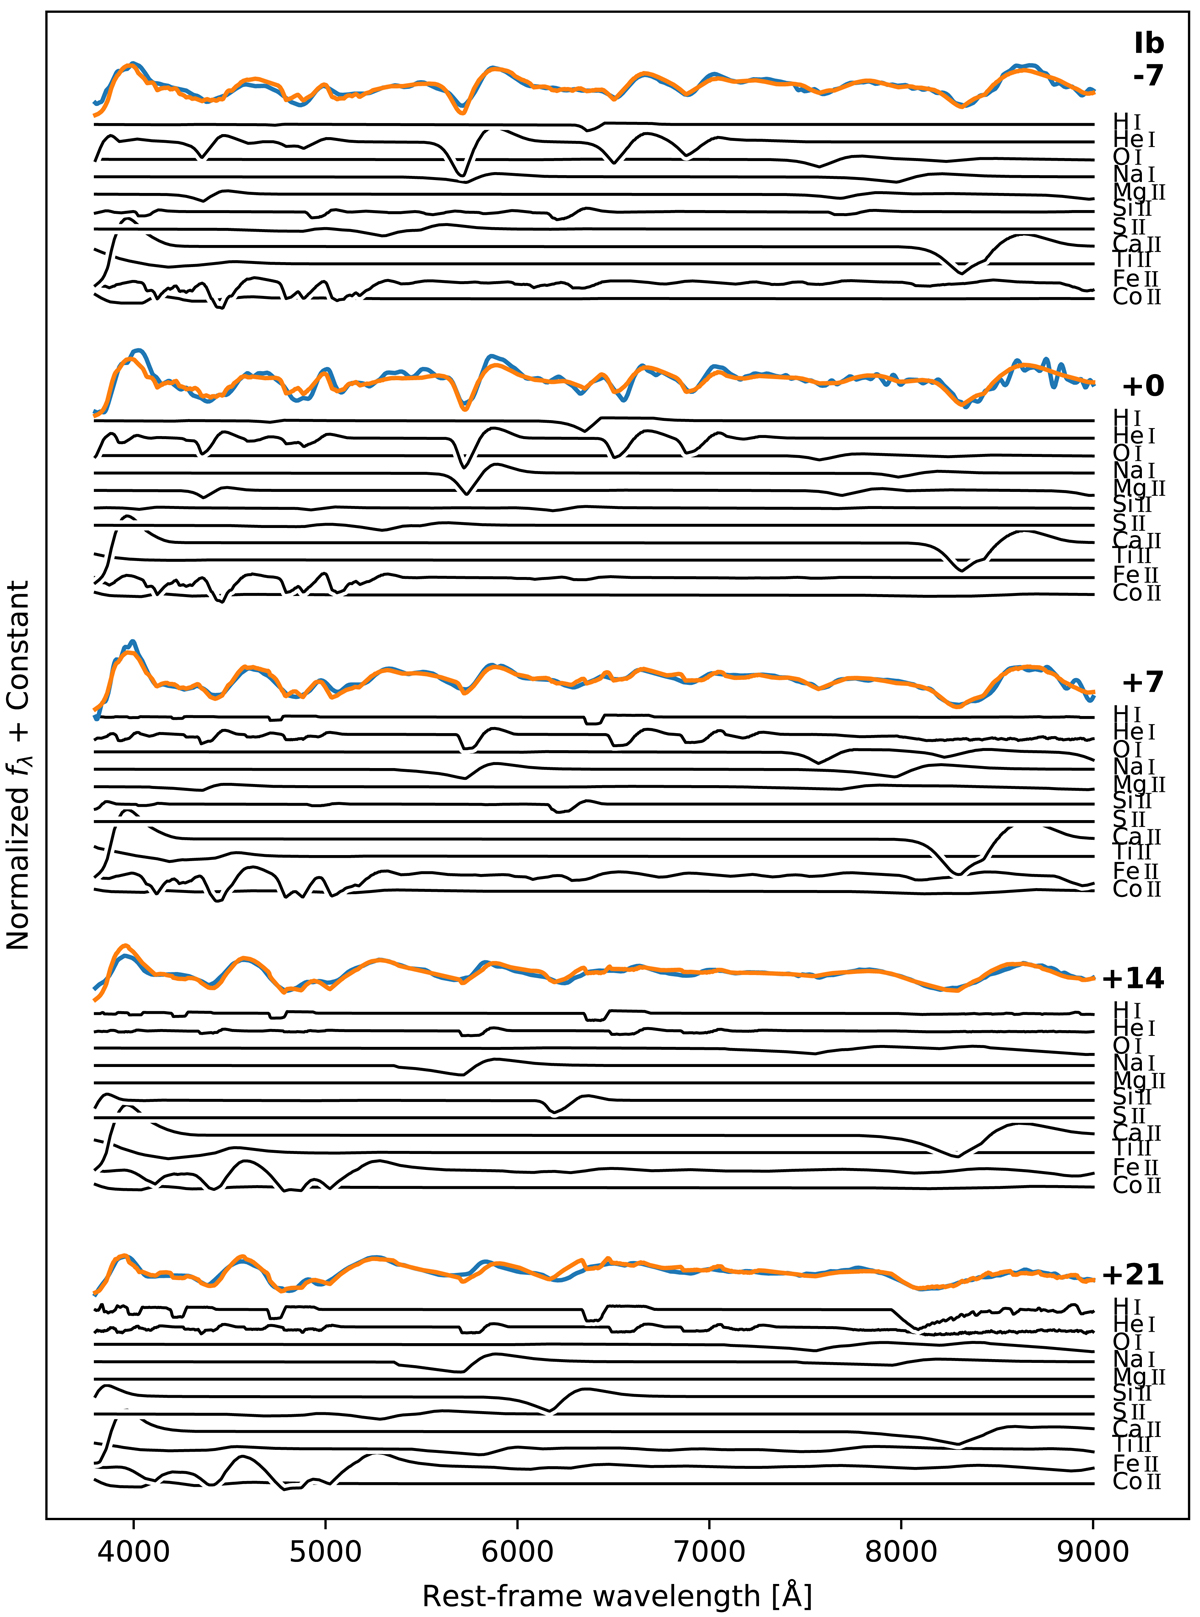
SYNAPPS fits (red lines) computed for SE SN template spectra (black lines) representing epochs of −7 d, +0 d, +7 d, +14 d and +21d. Each mean template spectrum was computed using data obtained within ±3.5 days relative to its specific epoch. Spectral features attributed to each ion are also plotted in black.
Current usage metrics show cumulative count of Article Views (full-text article views including HTML views, PDF and ePub downloads, according to the available data) and Abstracts Views on Vision4Press platform.
Data correspond to usage on the plateform after 2015. The current usage metrics is available 48-96 hours after online publication and is updated daily on week days.
Initial download of the metrics may take a while.