Fig. 10.
Download original image
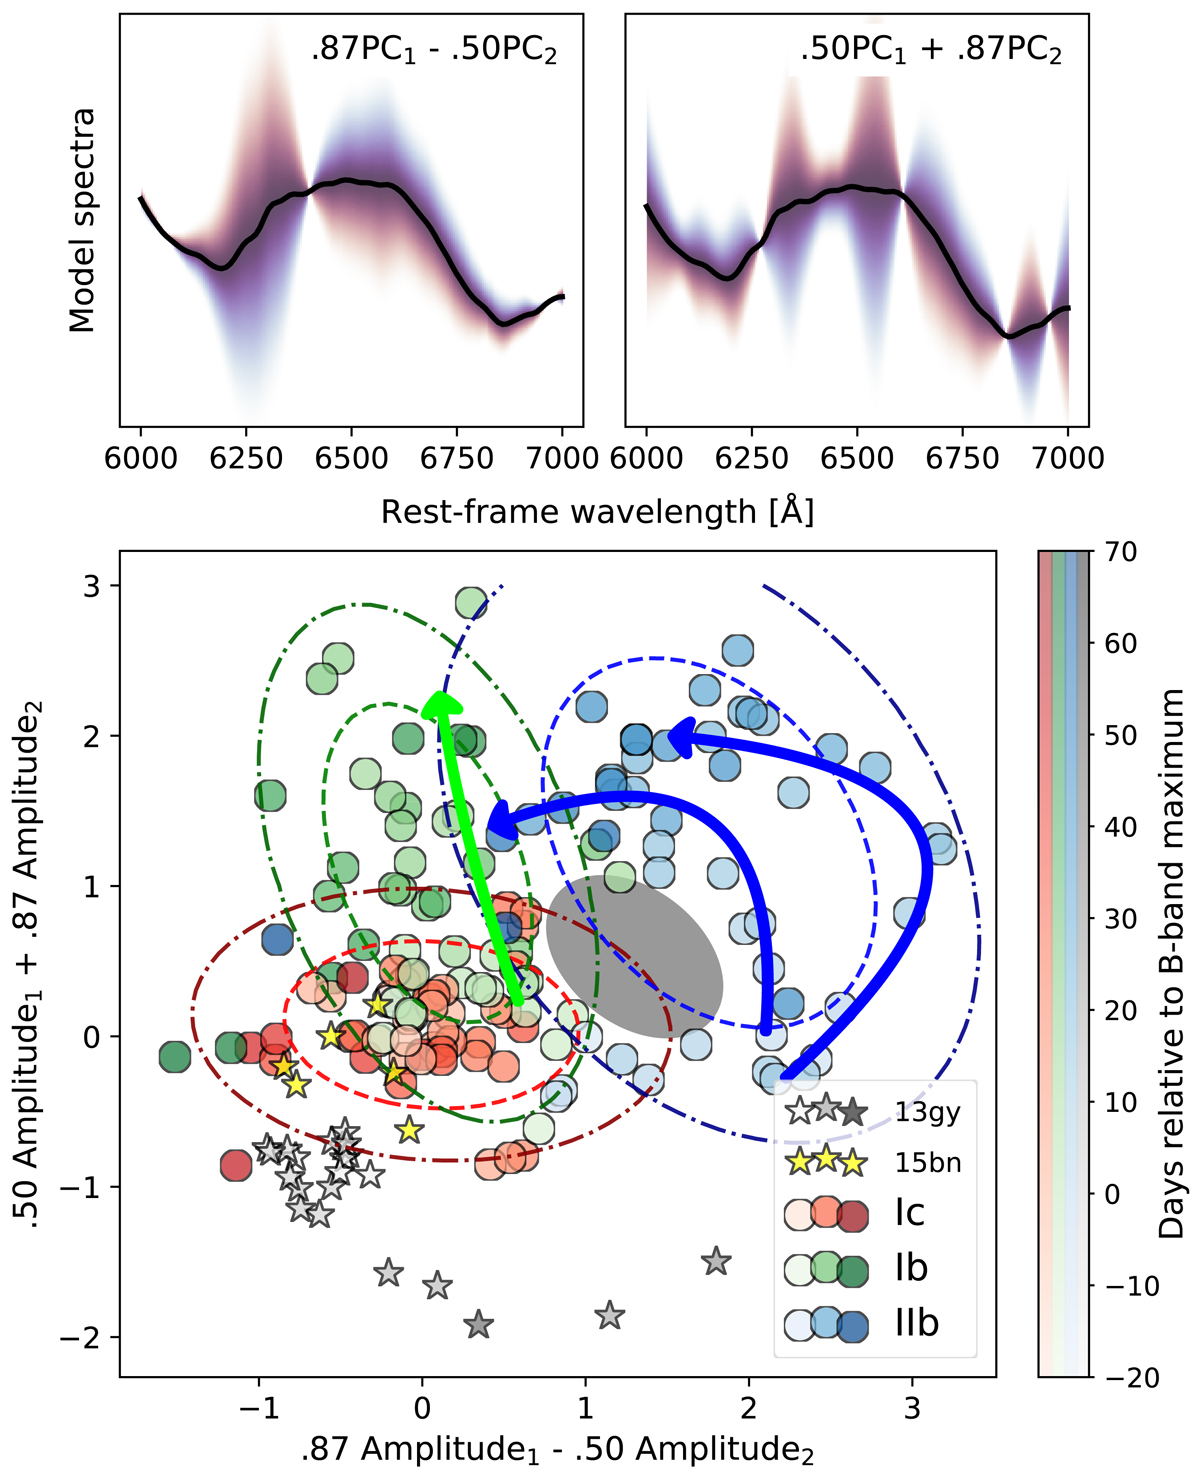
Results from PCA. Top: linear combinations of the first two PCs determined from PCA applied to the spectra extending to +70 d and between 6000–7000 Å. Bottom: a linear combination of Amplitude1 and Amplitude2 plotted versus its orthogonal (30°) rotation. In addition to the CSP-I SE SN sample, PCA resutls are shown for the normal Type Ia SN 2013gy (Holmbo et al. 2019) and unpublished CSP-II spectra of the Type Ic superluminous SN 2015bn (Phillips et al. 2019). Solid curved lines highlight subtypes of He I-rich SE SNe (see Sect. 5.3). GMM clusters are indicated with one and two sigma contours for each cluster using dashed and dot-dashed lines (see Sect. 5.3.1 and Table 3), respectively. To guide the eye, curved arrows are over-plotted highlighting the temporal evolution of SNe IIb and SNe Ib.
Current usage metrics show cumulative count of Article Views (full-text article views including HTML views, PDF and ePub downloads, according to the available data) and Abstracts Views on Vision4Press platform.
Data correspond to usage on the plateform after 2015. The current usage metrics is available 48-96 hours after online publication and is updated daily on week days.
Initial download of the metrics may take a while.