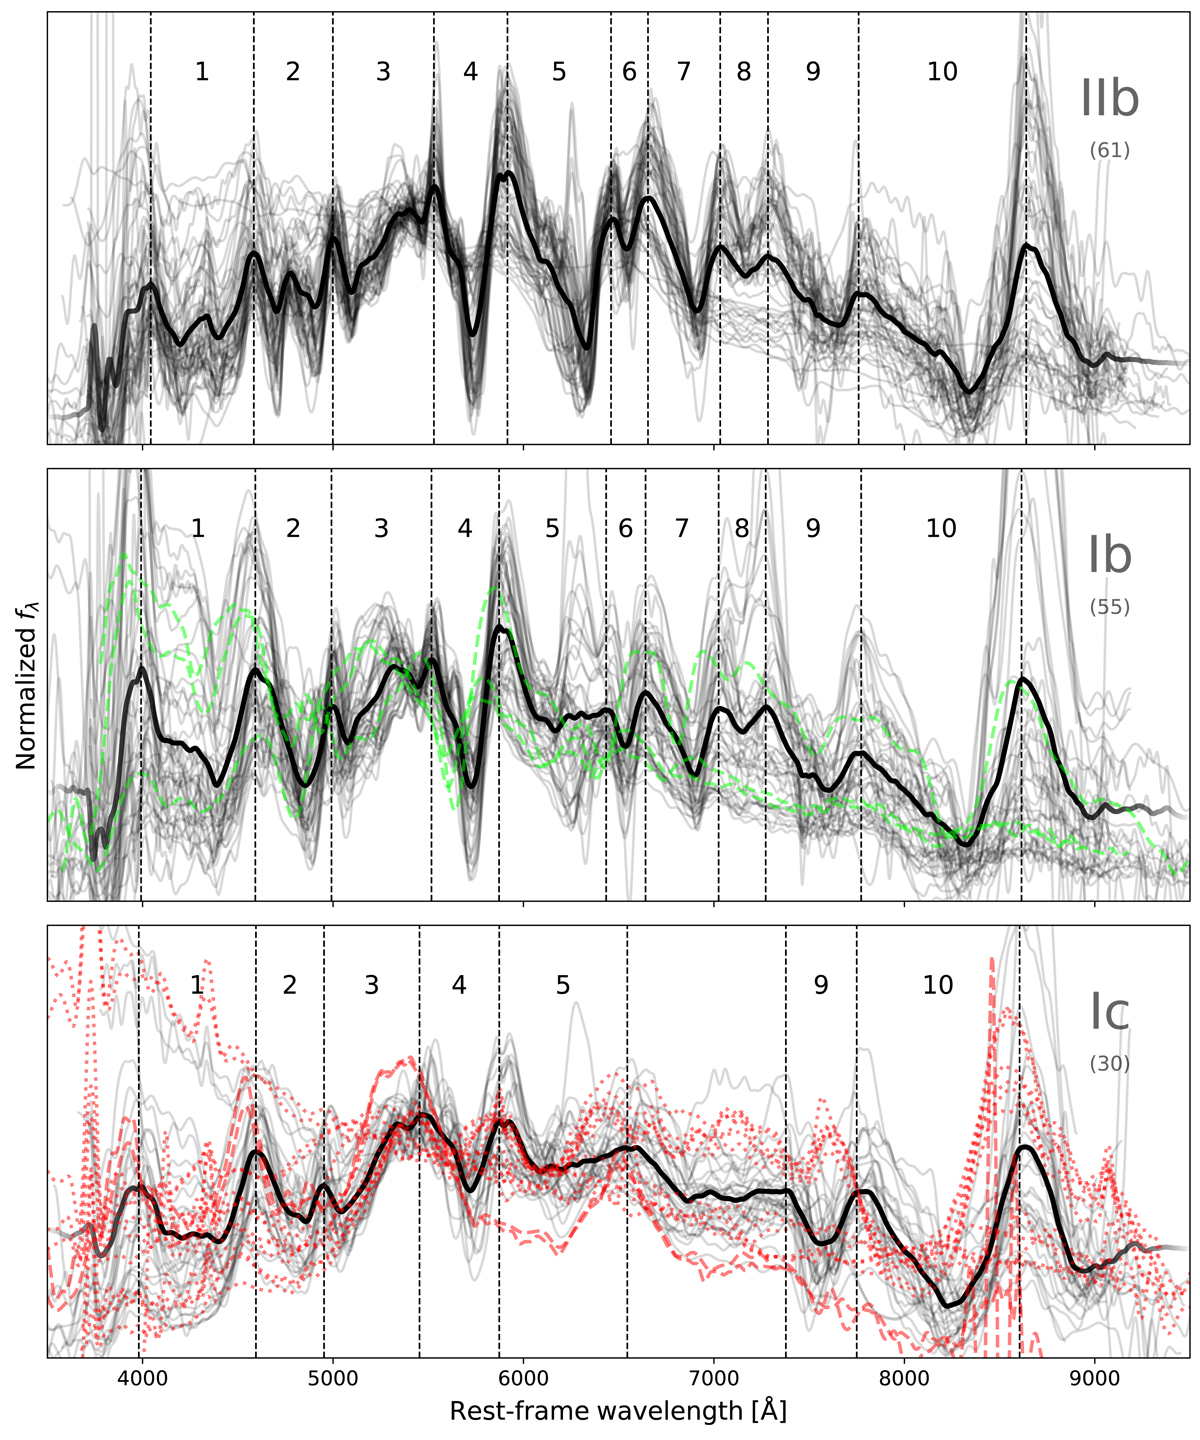
Fig. 1.

Download original image
Median spectrum for each SE SN subtype (black line) constructed from all of the spectra plotted in gray and listed in Table 1. The vertical dashed lines indicate 10 regions of interest. Regions 1–5, 9 and 10 are typically present in each SE SN subtype, while regions 6–8 are typically found in SNe IIb and SNe Ib and are usually most prevalent in the weeks after maximum light. Green lines in the middle panel are spectra of the high-velocity Type Ib SN 2004gq, and red lines plotted in the bottom panel correspond to the spectra of the Type Ic-BL SN 2009bb (dotted) and the unusual Type Ic SN 2009ca (dashed). These spectra were excluded in making the median spectra. Finally, the number of spectra used to create each median spectrum plotted in each panel is indicated within parenthesis located just below the given spectral subtypes.
Current usage metrics show cumulative count of Article Views (full-text article views including HTML views, PDF and ePub downloads, according to the available data) and Abstracts Views on Vision4Press platform.
Data correspond to usage on the plateform after 2015. The current usage metrics is available 48-96 hours after online publication and is updated daily on week days.
Initial download of the metrics may take a while.


