Fig. 7.
Download original image
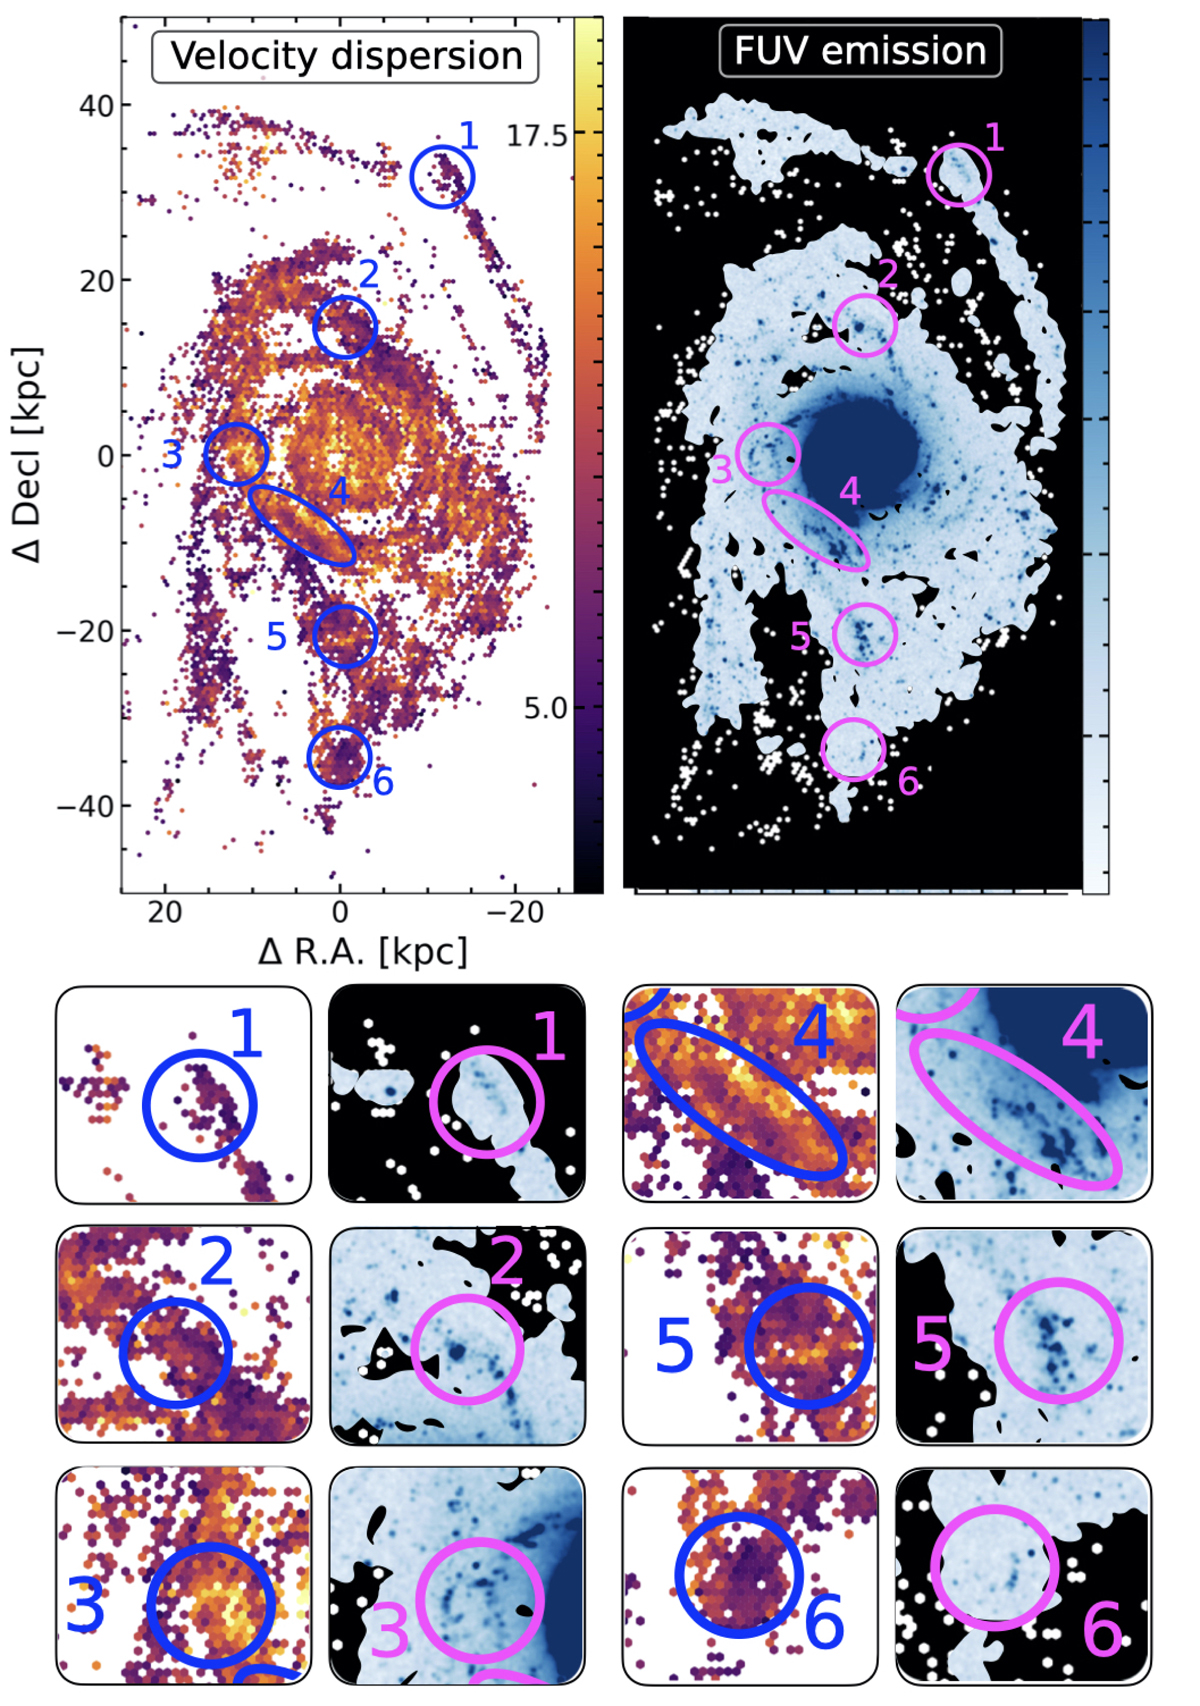
Velocity dispersion and FUV emission. Visual inspection of spatial correlation of velocity dispersion (σeff the colorbar represents units of km s−1) and FUV emission as an indicator of star formation (in units of mJy arcsec−2). The FUV emission is the same GALEX FUV map as shown by Bigiel et al. (2010a). We defined 6 individual sub-regions in the ring, southern area, southern and northern arm, based on where we see either stronger FUV emission or enhanced velocity dispersion. See Sect. 4.1 for the discussion on the different regions.
Current usage metrics show cumulative count of Article Views (full-text article views including HTML views, PDF and ePub downloads, according to the available data) and Abstracts Views on Vision4Press platform.
Data correspond to usage on the plateform after 2015. The current usage metrics is available 48-96 hours after online publication and is updated daily on week days.
Initial download of the metrics may take a while.