Fig. 6.
Download original image
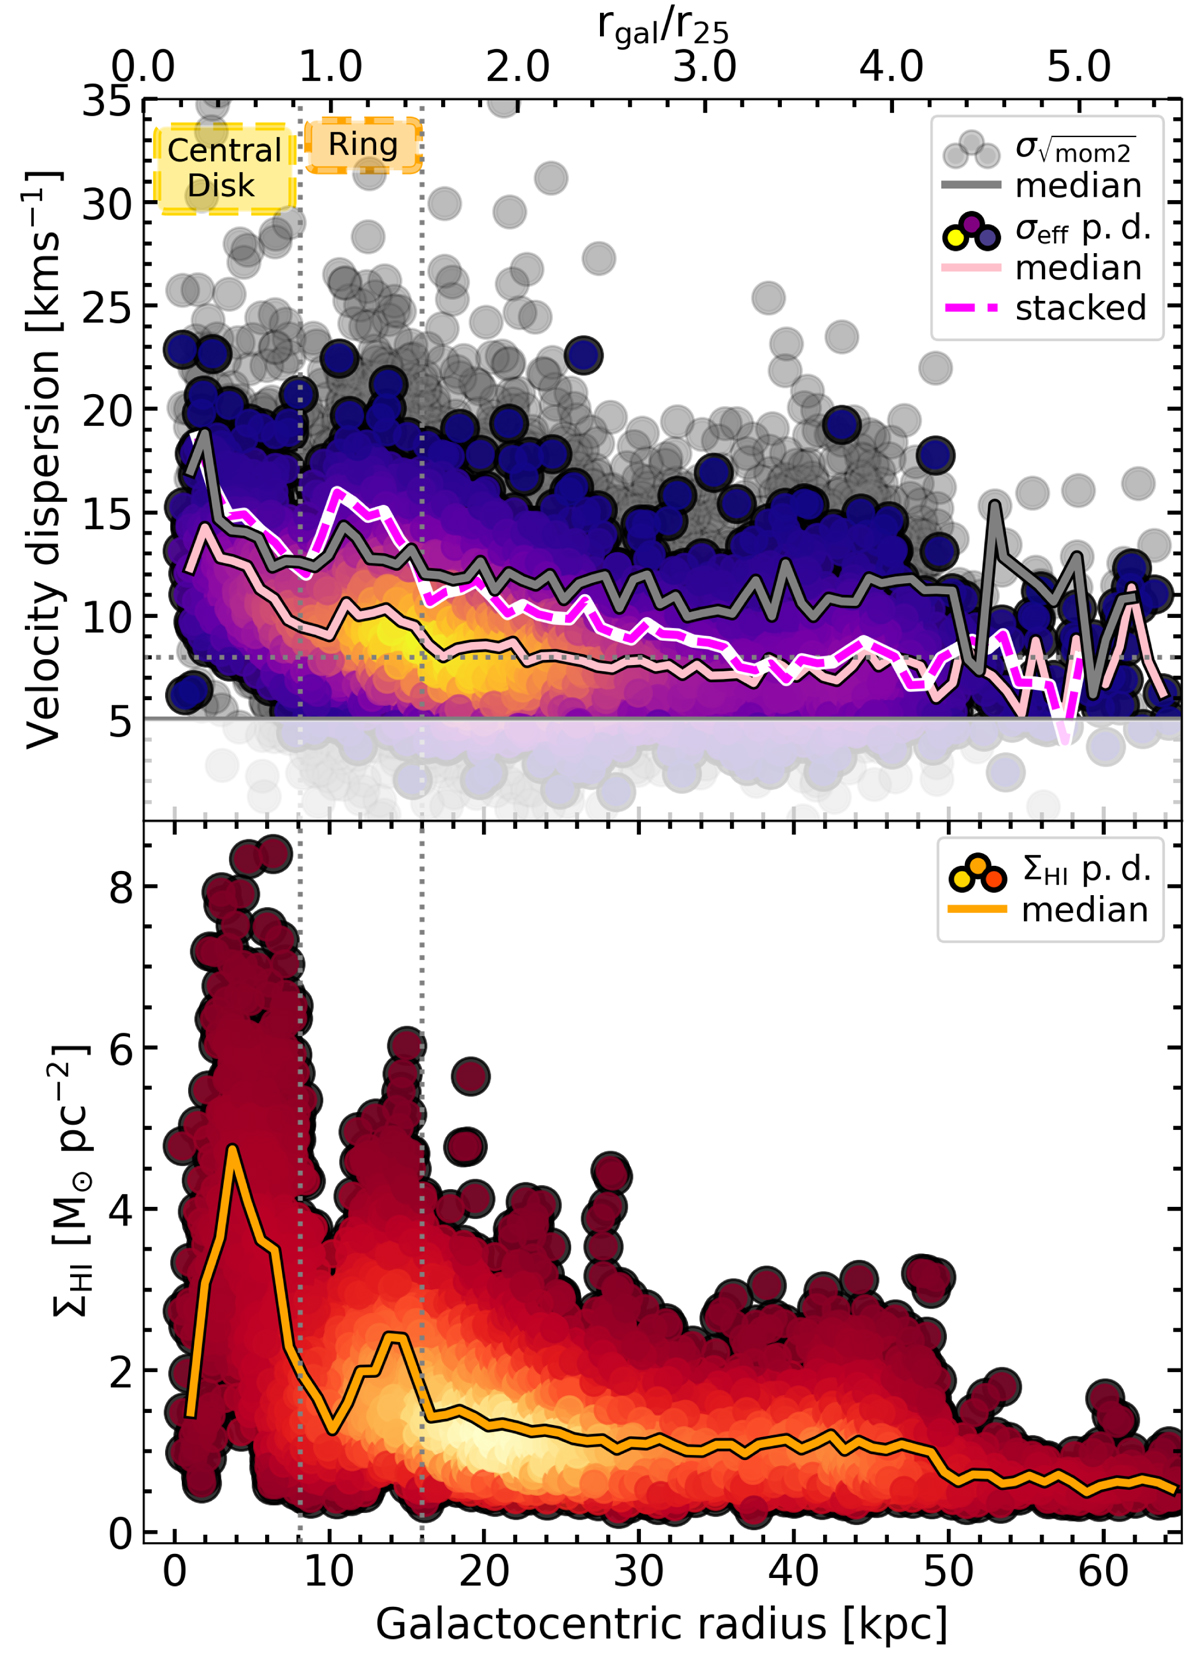
Radial profile of the velocity dispersion, σv, and the H I gas surface density ΣHI, together with the point density of σv and ΣHI for individual lines of sight (circular points; the color-coding reflects a linear density distribution, where the highest density is shown in yellow). Top panel: We compare here the effective width (σeff purple-to-yellow scatter points) and ![]() (
(![]() grey points) approaches to estimate the velocity dispersion across the whole disk of M 83. We show the median for
grey points) approaches to estimate the velocity dispersion across the whole disk of M 83. We show the median for ![]() (grey solid line), the median for σeff (pink solid line), and the results after stacking σeff (pink-white dashed line). We see in all three cases enhanced velocity dispersion in the central disk and in the ring (indicated by the dashed vertical lines at 8.1 kpc and 16 kpc). The horizontal dashed line indicates the 8 km s−1 limit that we discuss in Sect. 4.1. Bottom panel: The profile of the H I gas surface density shows an enhancement of H I gas in the ring. This is similar to the velocity dispersion profiles.
(grey solid line), the median for σeff (pink solid line), and the results after stacking σeff (pink-white dashed line). We see in all three cases enhanced velocity dispersion in the central disk and in the ring (indicated by the dashed vertical lines at 8.1 kpc and 16 kpc). The horizontal dashed line indicates the 8 km s−1 limit that we discuss in Sect. 4.1. Bottom panel: The profile of the H I gas surface density shows an enhancement of H I gas in the ring. This is similar to the velocity dispersion profiles.
Current usage metrics show cumulative count of Article Views (full-text article views including HTML views, PDF and ePub downloads, according to the available data) and Abstracts Views on Vision4Press platform.
Data correspond to usage on the plateform after 2015. The current usage metrics is available 48-96 hours after online publication and is updated daily on week days.
Initial download of the metrics may take a while.