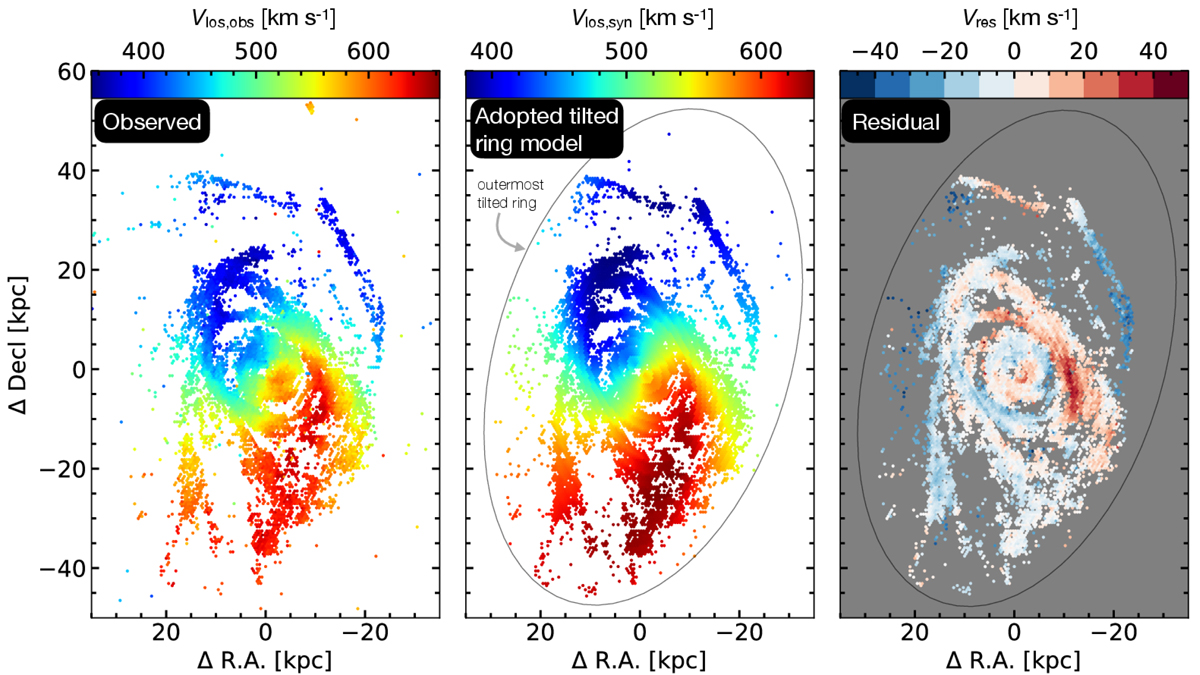
Fig. 4.
Download original image
Observed, adopted, and residual velocity maps. Observed: velocity field of M 83 using our VLA H I observations. The blue colors represent the approaching and the red is the receding side of the H I galaxy disk. Adopted tilted ring model: constructed velocity field using Vsys, Vrot, i, and position angle of the tilted ring model by Heald et al. (2016). The green colors represent the systemic velocity of ∼510 km s−1 for the inner ∼23 kpc in galactocentric radius and ∼500 km s−1 beyond (see Sect. 2.6.1). The tilting results in gaps between the rings, which we interpolated for the presentation of these maps (2d interpolation, see Fig. 11). We had to restrict our field of view to the model outputs (i.e. the outermost tilted ring). Residual: The difference between the observed velocities and the modeled velocities; in the range of −40 to 40 km s−1.
Current usage metrics show cumulative count of Article Views (full-text article views including HTML views, PDF and ePub downloads, according to the available data) and Abstracts Views on Vision4Press platform.
Data correspond to usage on the plateform after 2015. The current usage metrics is available 48-96 hours after online publication and is updated daily on week days.
Initial download of the metrics may take a while.