Fig. D.2.
Download original image
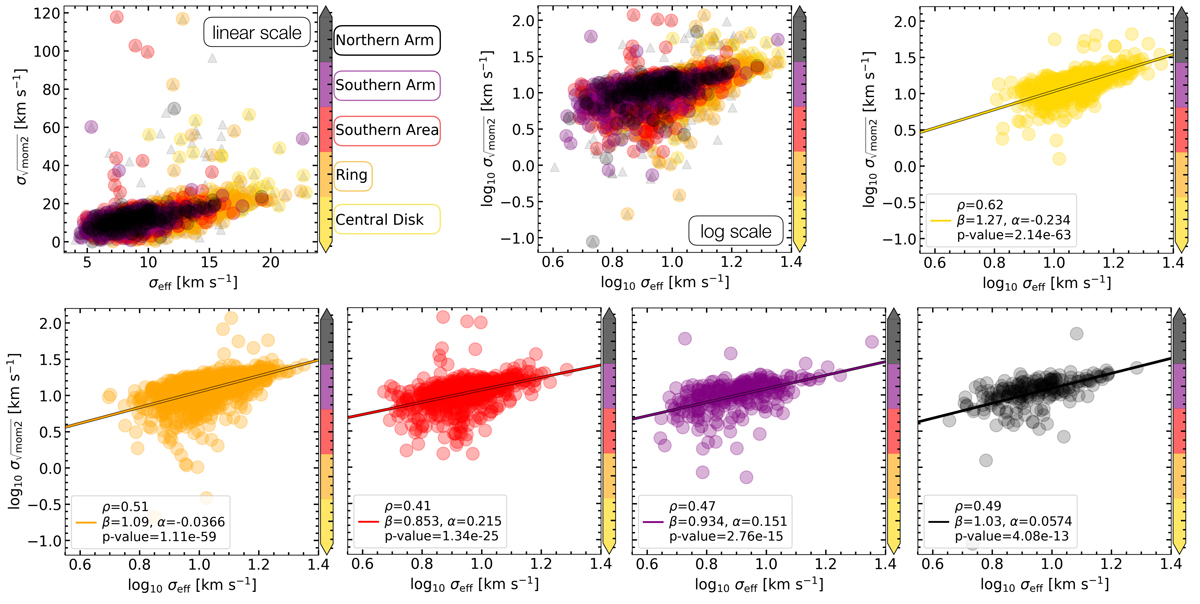
Comparison of two approaches to determine the velocity dispersion. In all panels, the y-axes show the ![]() and the x-axes the σeff values colored by the regions defined within this work (see the mask in Figure 5). Only the upper left panel shows the x and y axes in linear scale, all the others are in log scale. We show linear regression fits between
and the x-axes the σeff values colored by the regions defined within this work (see the mask in Figure 5). Only the upper left panel shows the x and y axes in linear scale, all the others are in log scale. We show linear regression fits between ![]() and σeff for the central disk (yellow), ring (orange), southern area (red), southern arm (purple), and northern arm (black). We see the highest scatter in
and σeff for the central disk (yellow), ring (orange), southern area (red), southern arm (purple), and northern arm (black). We see the highest scatter in ![]() in the ring region of ∼2.5dex. This is likely to represent a multi-component spectrum.
in the ring region of ∼2.5dex. This is likely to represent a multi-component spectrum.
Current usage metrics show cumulative count of Article Views (full-text article views including HTML views, PDF and ePub downloads, according to the available data) and Abstracts Views on Vision4Press platform.
Data correspond to usage on the plateform after 2015. The current usage metrics is available 48-96 hours after online publication and is updated daily on week days.
Initial download of the metrics may take a while.