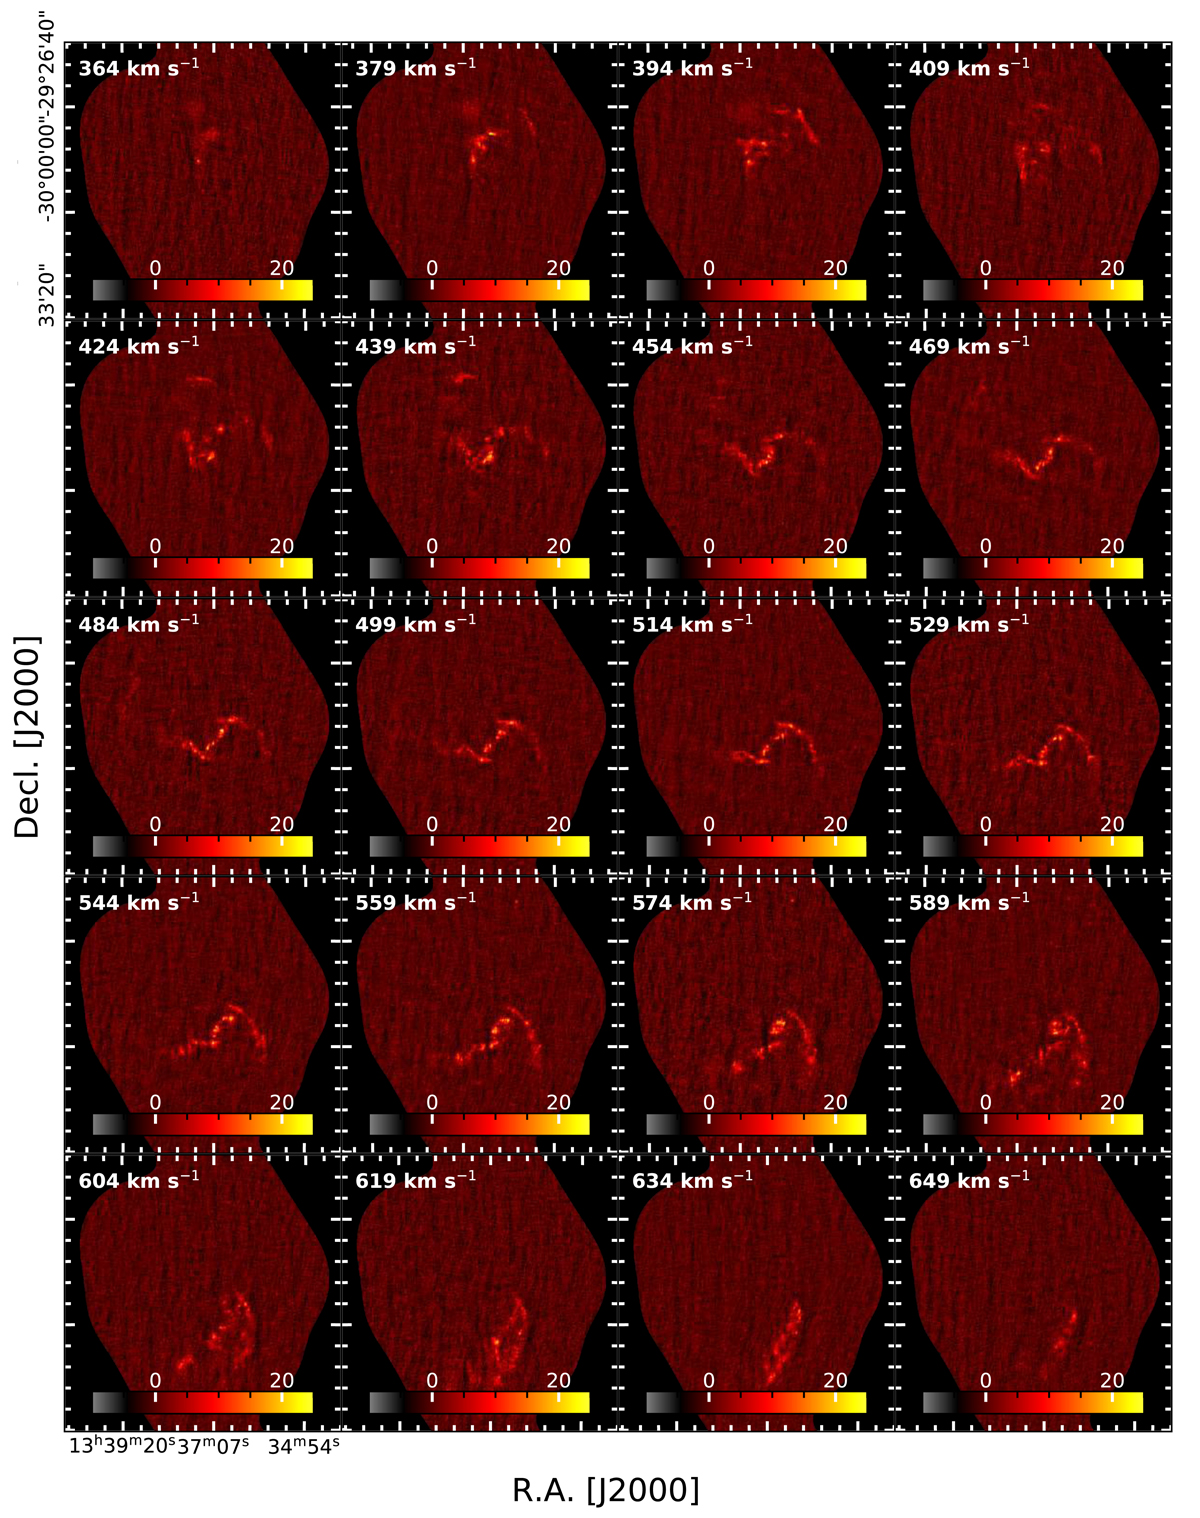
Fig. 2.
Download original image
Channel maps of our VLA+GBT data. The line-of-sight velocity of the shown channels is displayed on the upper left corner of each panel and the colorbar is shown in units of K. For visual purpose we only show every third 5.0 km s−1 channel (i.e. we do not integrate over channels). The companion galaxy UGCA 365 is detected in the velocity channels 559 km s−1 and 574 km s−1. We show all channels in the appendix (see Appendix B).
Current usage metrics show cumulative count of Article Views (full-text article views including HTML views, PDF and ePub downloads, according to the available data) and Abstracts Views on Vision4Press platform.
Data correspond to usage on the plateform after 2015. The current usage metrics is available 48-96 hours after online publication and is updated daily on week days.
Initial download of the metrics may take a while.