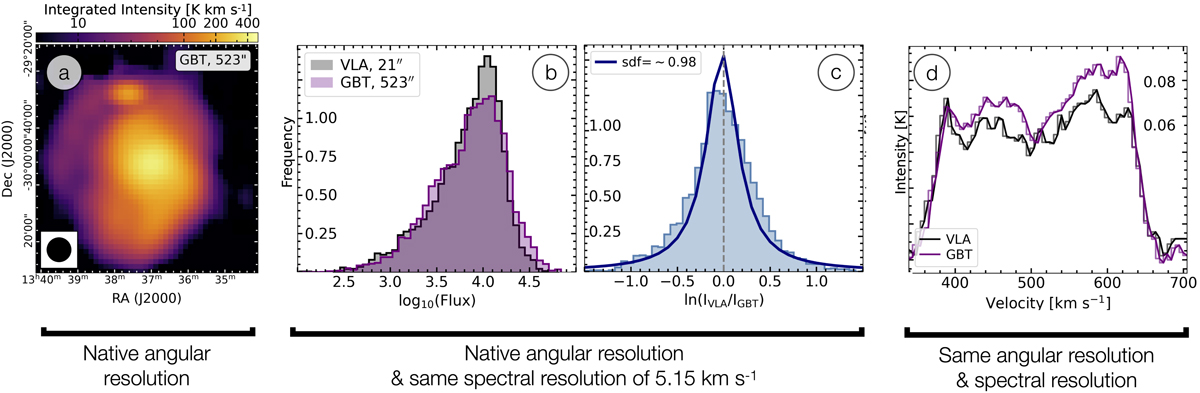
Fig. A.1.
Download original image
Image combination. (a) We show the integrated intensity maps of the GBT observation at native angular resolution. (b) Shows the distribution of the flux of the single dish (SD) and VLA data at matched spectral resolution (i.e. we regridded the VLA to the GBT spectral resolution). (c): We used the uvcombine python package to find the single dish scaling factor (sdf; blue line). The ratio of the low-res and high-res observations result in a Cauchy distribution. We fit the log of the ratio to a Cauchy distribution (blue histogram) and its mean is then an estimate for the scaling factor. (d): The spectra of the VLA and GBT observation at matched angular and spectral resolution (i.e. we gaussian convolve and regridded the VLA to the GBT angular and spectral resolution).
Current usage metrics show cumulative count of Article Views (full-text article views including HTML views, PDF and ePub downloads, according to the available data) and Abstracts Views on Vision4Press platform.
Data correspond to usage on the plateform after 2015. The current usage metrics is available 48-96 hours after online publication and is updated daily on week days.
Initial download of the metrics may take a while.