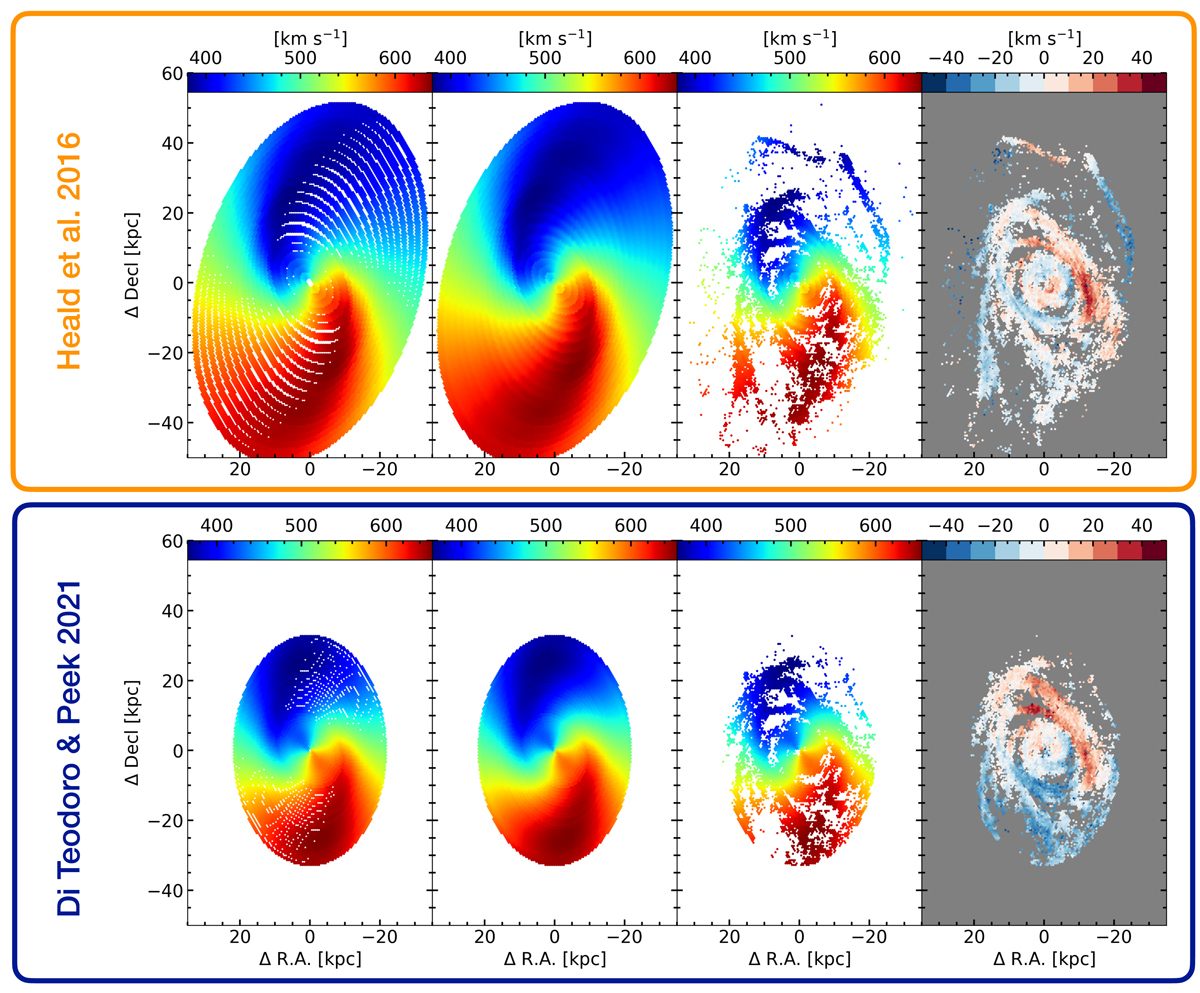
Fig. 11.
Download original image
Comparison of residual maps. Here we compare the modeled and residual maps (Vlos, mdl and Vres) of different initial parameters (shown in Fig. 10) that we obtained by using Eq. (8). Upper row: the tilted rings using (Heald et al. 2016) model outputs that are based on their KAT7 observations and using rotcurv. For visualisation reasons, we interpolated the gaps using the scipy function 2d interpolation. For further analysis we focus on the tilted-ring frame. Lower row: the tilted rings using (Di Teodoro & Peek 2021) model outputs that are based on LVHIS observations and using BBarolo. The field of view is restricted to their Vrot parameters. Therefore the southern and northern arm are not evident in the residual map.
Current usage metrics show cumulative count of Article Views (full-text article views including HTML views, PDF and ePub downloads, according to the available data) and Abstracts Views on Vision4Press platform.
Data correspond to usage on the plateform after 2015. The current usage metrics is available 48-96 hours after online publication and is updated daily on week days.
Initial download of the metrics may take a while.