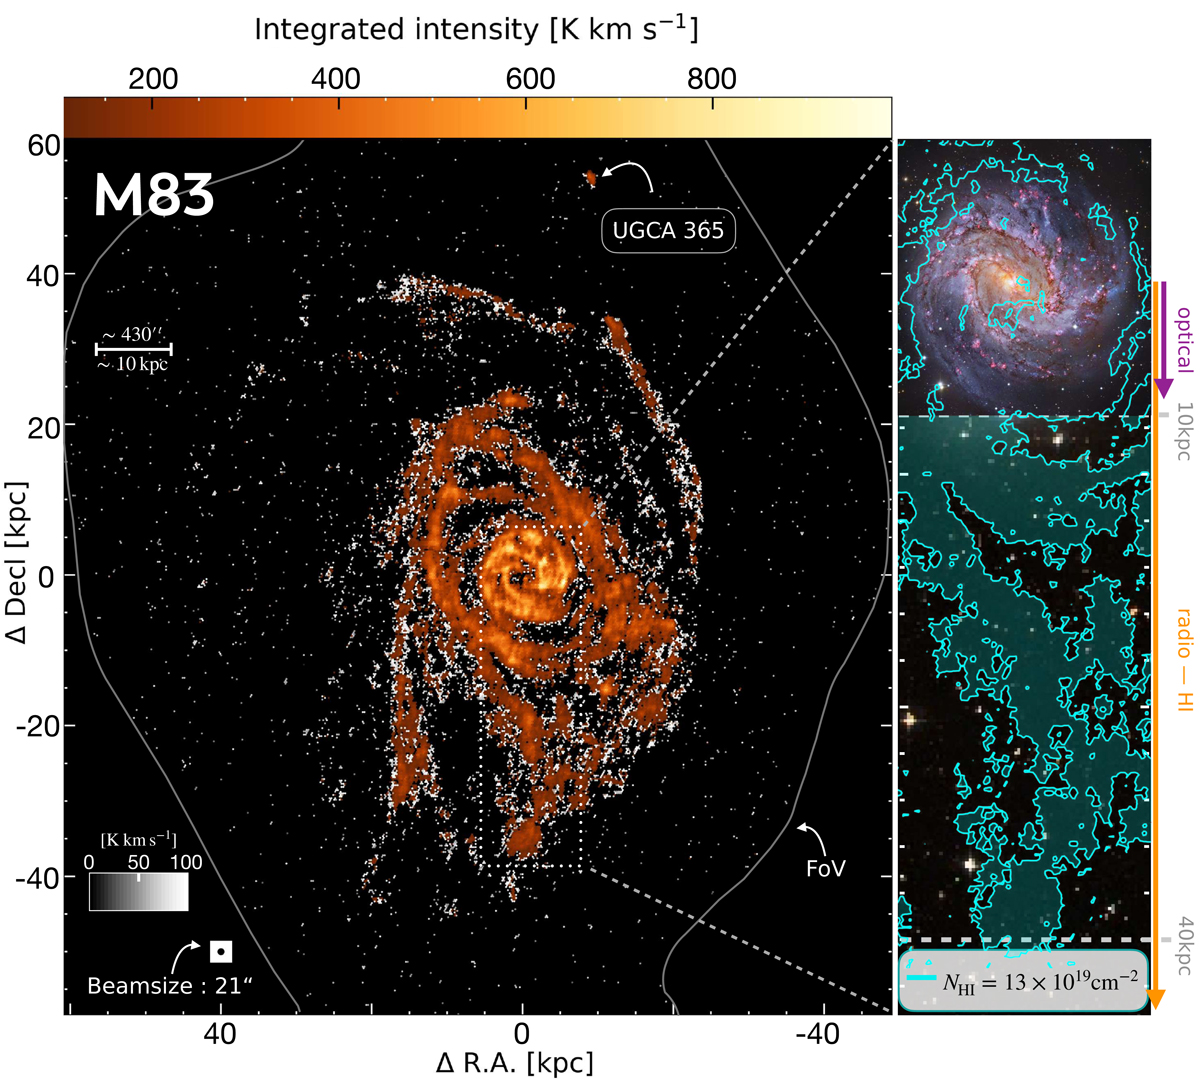
Fig. 1.
Download original image
Integrated intensity map (moment 0) for H I emission across the disk of M 83 at a resolution of 21″. The black circle in the lower left corner marks the beam size of 21″ (≈500 pc). The black to white colorbar indicates integrated intensities from 0 − 100 K km s1 and the orange to yellow integrated intensities above 101 K km s1. We denote the companion galaxy UGCA 365 which in projection is ∼55 kpc away from the center of M 83. To the right, we show the enclosed optical disk (r25 ∼ 8 kpc) overlaid with H I column density contour (NHI = 13 × 1019 cm−2) extending over a radius of ∼40 kpc. For visualization reasons, we show unfilled NHI contours for the high resolution optical image. Beyond 10 kpc we show filled NHI contours. The white line surrounding M 83 shows the field of view (FoV; i.e. the full mosaic coverage) of the VLA observation. (optical image credits: CTIO/NOIRLab/DOE/NSF/AURA, M. Soraisam; Image processing: Travis Rector, Mahdi Zamani & Davide de Martin; low resolution background > 10 kpc: DSS2).
Current usage metrics show cumulative count of Article Views (full-text article views including HTML views, PDF and ePub downloads, according to the available data) and Abstracts Views on Vision4Press platform.
Data correspond to usage on the plateform after 2015. The current usage metrics is available 48-96 hours after online publication and is updated daily on week days.
Initial download of the metrics may take a while.