Fig. 9.
Download original image
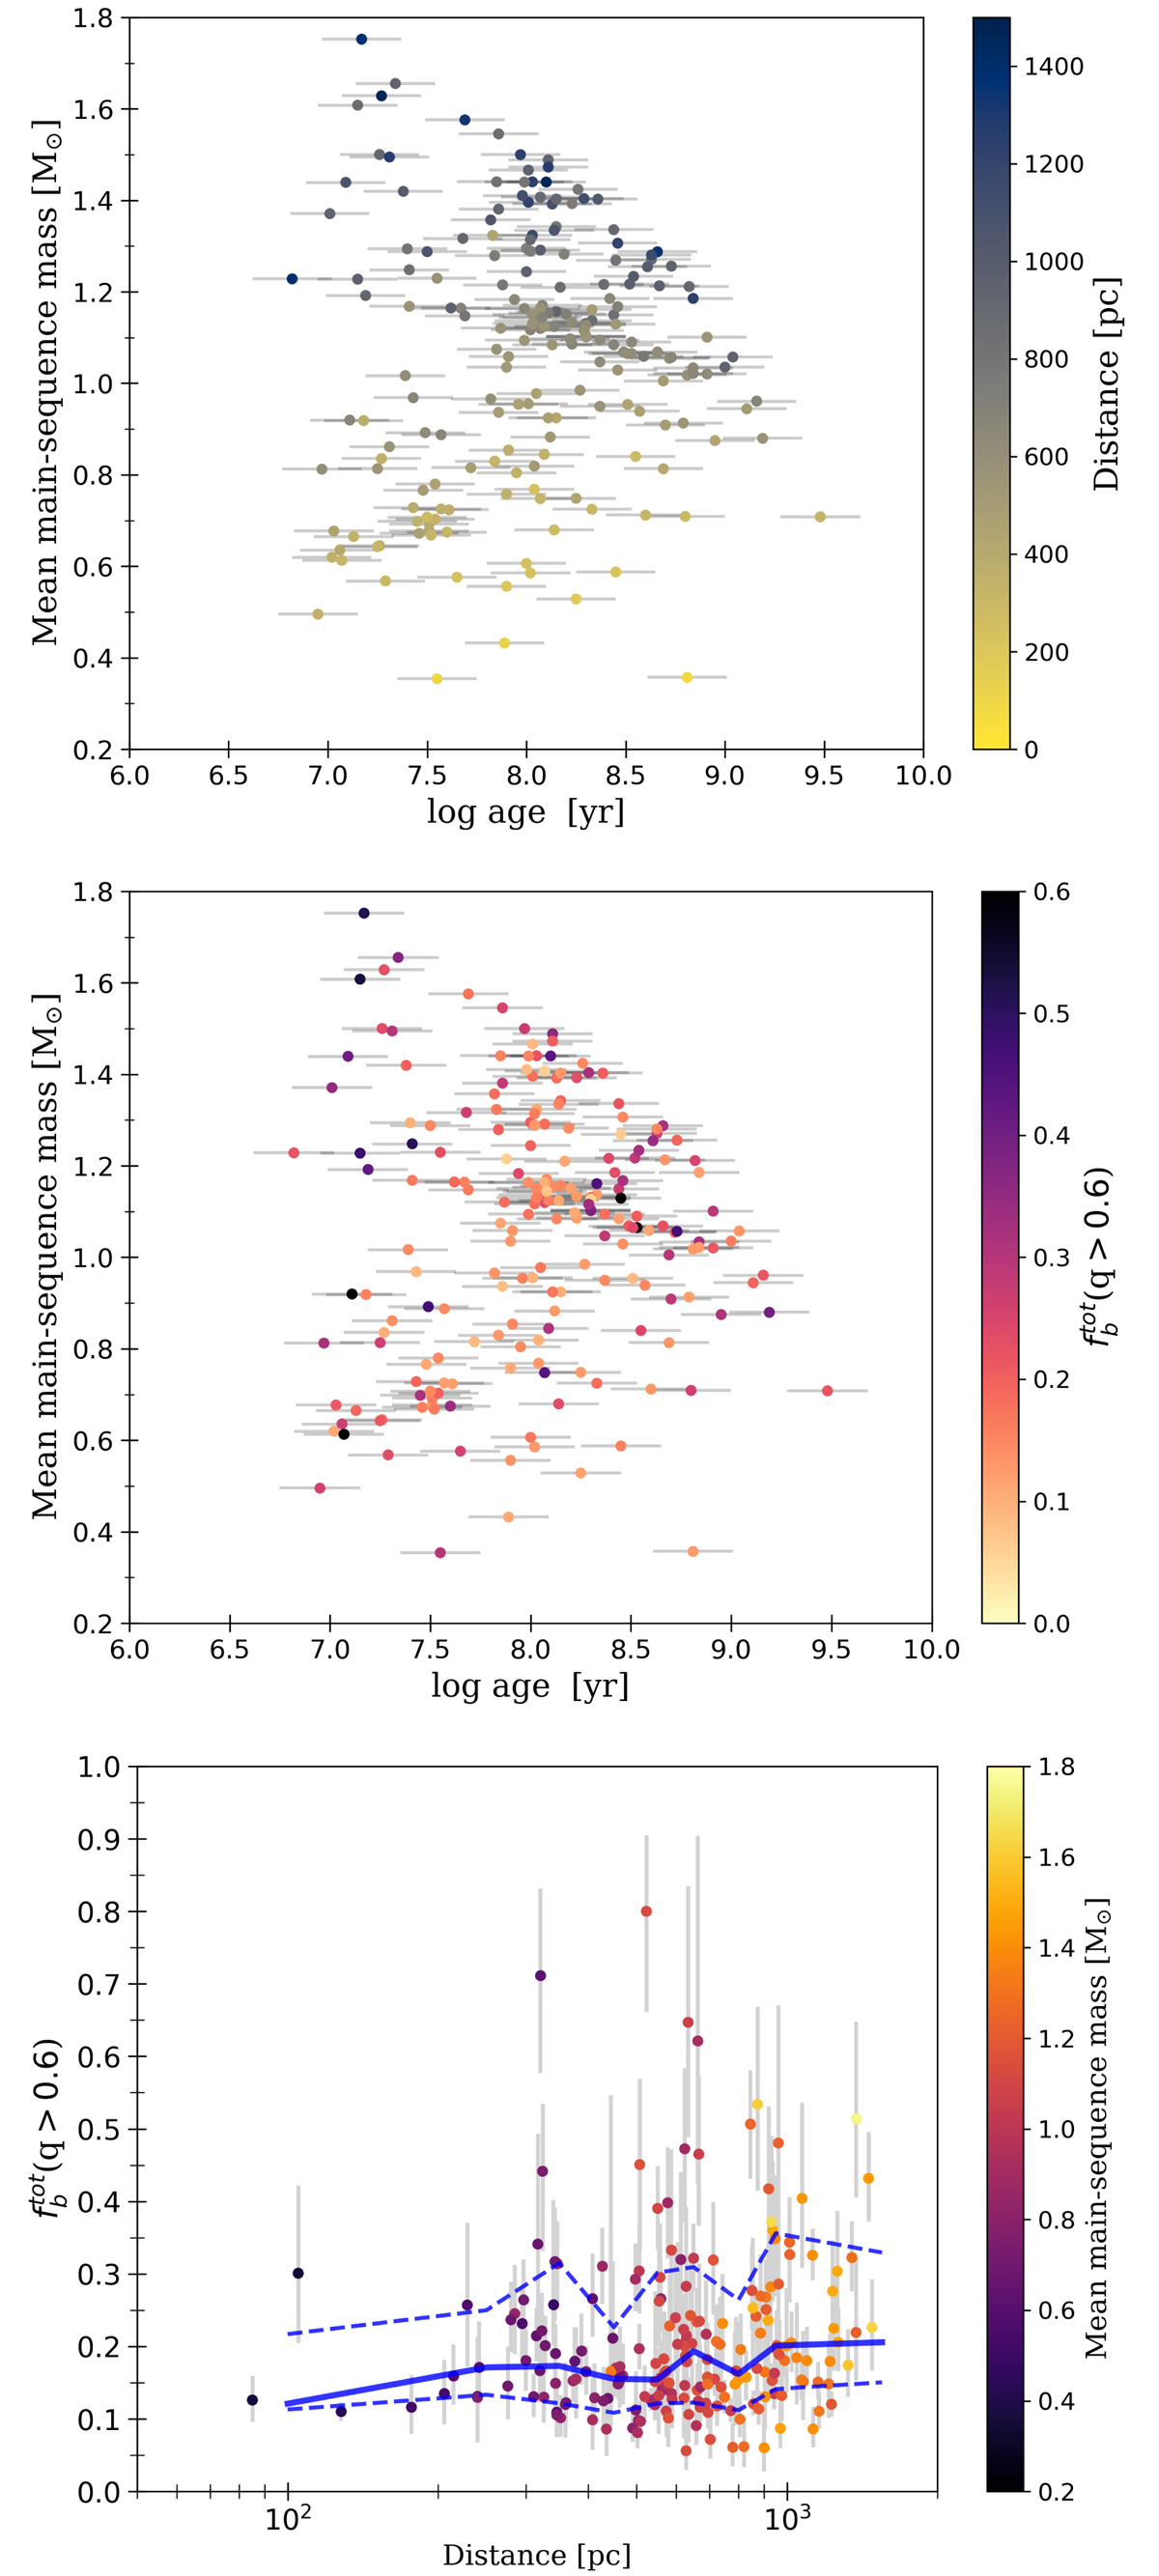
Correlations between age, distance, mean main-sequence mass, and multiplicity fraction for the 202 studied open clusters. Top panels: mean main-sequence mass of the open cluster as a function of logarithmic age, colour-coded by their distance (top panel) and by their total multiplicity fraction of systems with q > 0.6 (middle panel). Bottom panel: total multiplicity fraction of systems with q > 0.6 as a function of logarithmic distance, colour-coded by the mean main-sequence mass of each open cluster. The central thick blue line is the running median and the dashed blue lines are the 16th and 84th running percentiles.
Current usage metrics show cumulative count of Article Views (full-text article views including HTML views, PDF and ePub downloads, according to the available data) and Abstracts Views on Vision4Press platform.
Data correspond to usage on the plateform after 2015. The current usage metrics is available 48-96 hours after online publication and is updated daily on week days.
Initial download of the metrics may take a while.