Fig. A.1
Download original image
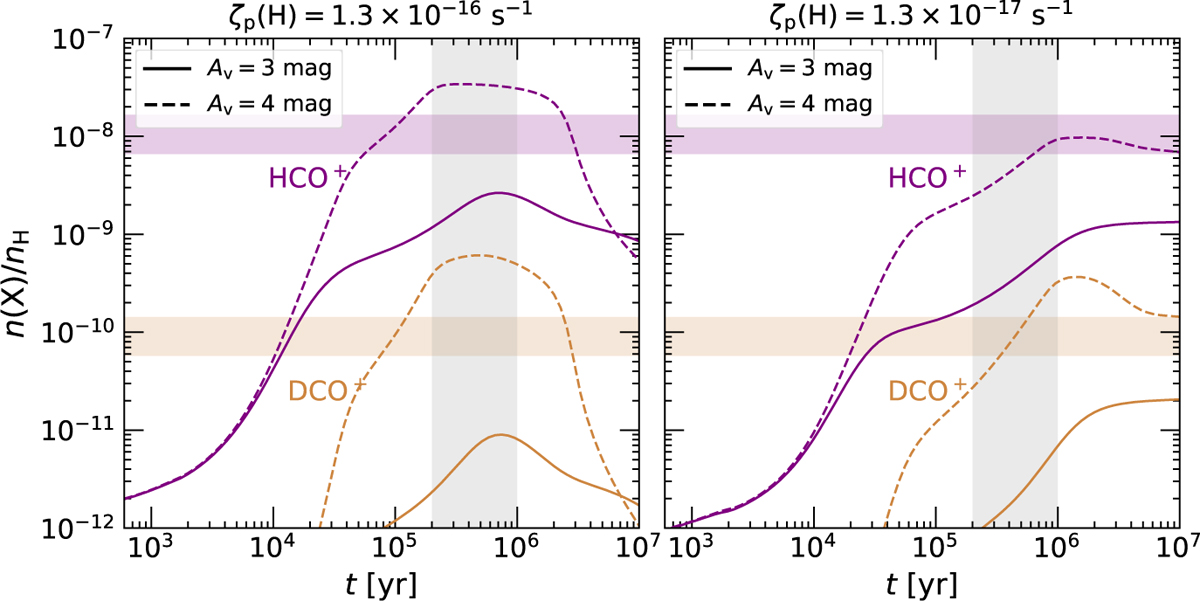
Modelled fractional abundances of HCO+ (in purple) and DCO+ (in yellow) with respect to the total gas density (nH) for models with ζp(H) and χUV = (1.3 × 10⁻¹⁶ s−1 6) (left) and (1.3 × 10⁻¹⁷ s−1, 6) (right), respectively. The solid and dashed curves represent the fractional abundances for Av = 3 and 4 mag, respectively, while the purple and yellow shaded regions represent the range of HCO+ and DCO+ abundances, respectively, as determined from values reported in van Dishoeck et al. (1995). The vertical grey shaded region represents the approximate age of the source.
Current usage metrics show cumulative count of Article Views (full-text article views including HTML views, PDF and ePub downloads, according to the available data) and Abstracts Views on Vision4Press platform.
Data correspond to usage on the plateform after 2015. The current usage metrics is available 48-96 hours after online publication and is updated daily on week days.
Initial download of the metrics may take a while.