Fig. 7
Download original image
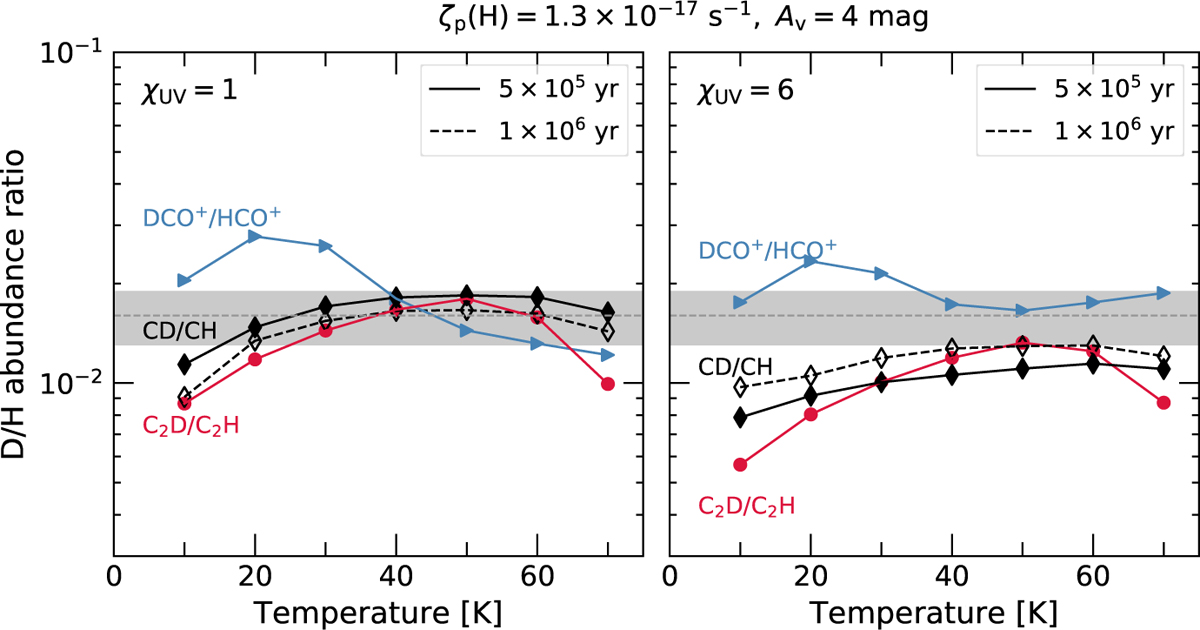
Modelled D/H abundance ratio for CH as a function of temperature computed for times t = 5 × 10⁵ yr (solid curve with diamond markers) and 1 × 10⁶ yr (dashed curve) for models with χUV = 1 (left) and χUV = 6 (right), where the horizontal grey shaded regions mark the dispersion in the CD/CH abundance ratio derived toward IRAS 16293-2422. For comparison, we also display the temperature dependence on the D/H abundance ratio for HCO+ (blue triangles) and C2H (red circles) at the time of t = 5 × 10⁵ yr.
Current usage metrics show cumulative count of Article Views (full-text article views including HTML views, PDF and ePub downloads, according to the available data) and Abstracts Views on Vision4Press platform.
Data correspond to usage on the plateform after 2015. The current usage metrics is available 48-96 hours after online publication and is updated daily on week days.
Initial download of the metrics may take a while.