Fig. 4
Download original image
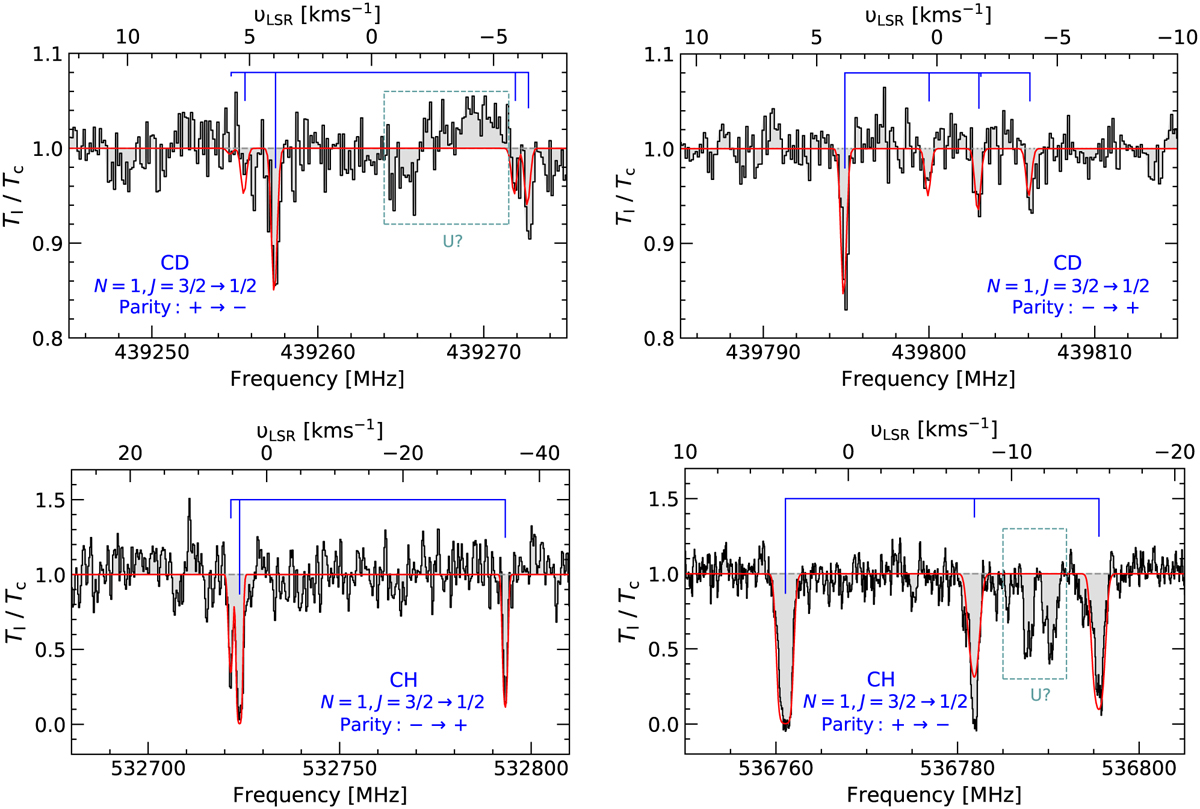
Spectra of the Ν = 1, J = 3/2 → 1/2 transitions of CD and CH. Top panel: filled grey histograms represent the normalised spectra of CD at 439 260 MHz (left) and 439 800 MHz (right) observed towards IRAS 16293–2422 alongside the GILDAS-Weeds model fit overlaid in red. The relative intensities of the HFS splitting components are marked in blue. Unidentified, contaminating spectroscopic and/or baseline features are labelled- U? in light blue. Bottom panel: same as the top panel but displaying the corresponding CH spectra at 532720 MHz (left) and 53 6780 MHz (right), respectively.
Current usage metrics show cumulative count of Article Views (full-text article views including HTML views, PDF and ePub downloads, according to the available data) and Abstracts Views on Vision4Press platform.
Data correspond to usage on the plateform after 2015. The current usage metrics is available 48-96 hours after online publication and is updated daily on week days.
Initial download of the metrics may take a while.