Fig. 2
Download original image
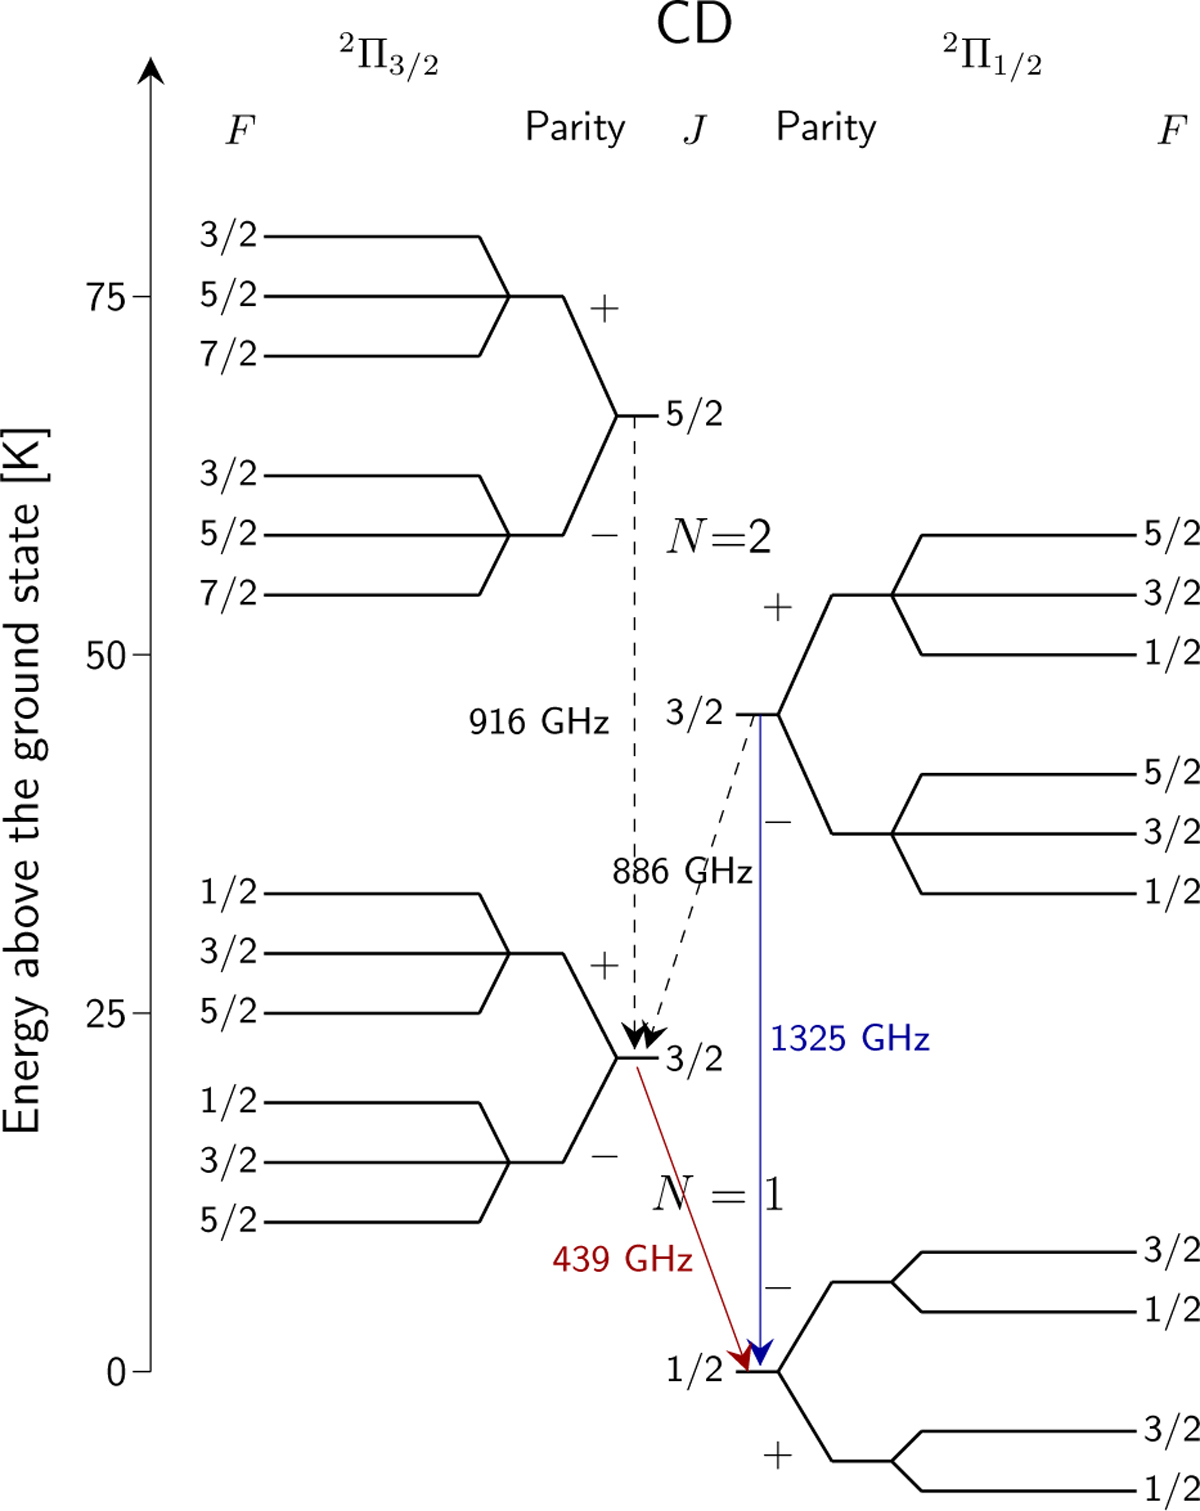
Energy-level diagram of the lowest rotational levels of CD, adapted from Fig. 1 of Halfen et al. (2008). The rotational transitions of CD discussed in the current study are highlighted using red and blue arrows. In addition, dashed black arrows indicate transitions of CD that were previously searched for, but remain undetected. We note that the level separations are not to scale.
Current usage metrics show cumulative count of Article Views (full-text article views including HTML views, PDF and ePub downloads, according to the available data) and Abstracts Views on Vision4Press platform.
Data correspond to usage on the plateform after 2015. The current usage metrics is available 48-96 hours after online publication and is updated daily on week days.
Initial download of the metrics may take a while.