Open Access
Fig. 5
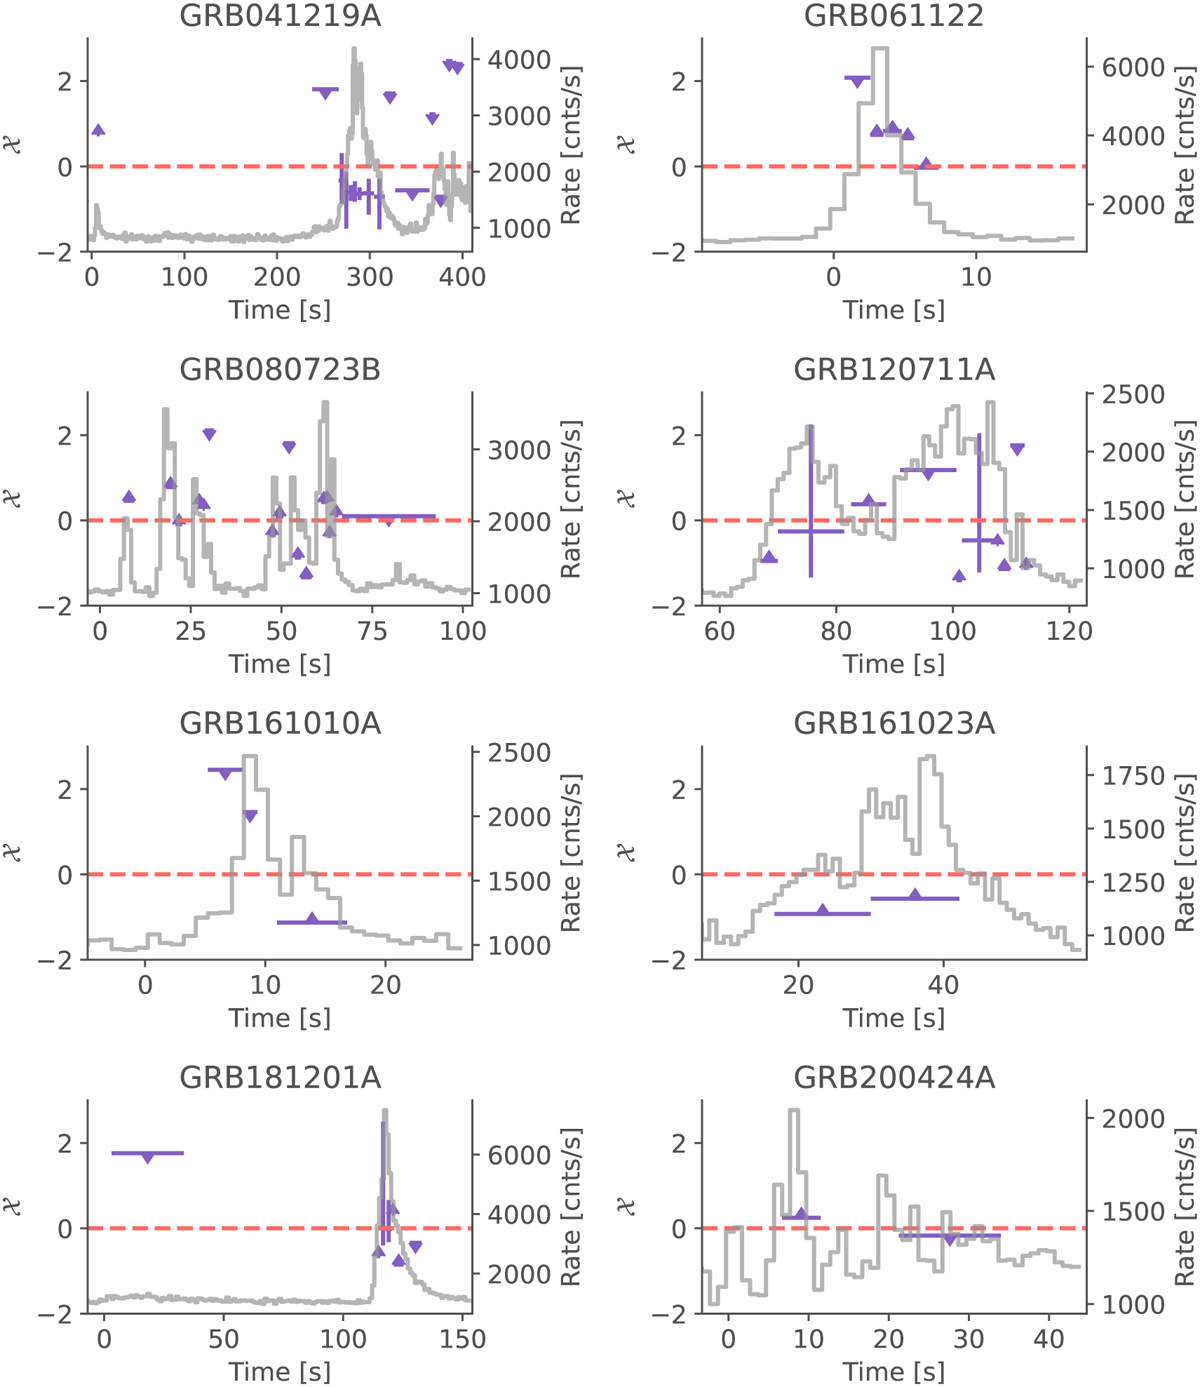
Download original image
Time evolution of X for the eight brightest GRBs in our sample. Values below (above) the red dashed lines indicates fast (slow) cooling. The light curve are plotted in light grey.
Current usage metrics show cumulative count of Article Views (full-text article views including HTML views, PDF and ePub downloads, according to the available data) and Abstracts Views on Vision4Press platform.
Data correspond to usage on the plateform after 2015. The current usage metrics is available 48-96 hours after online publication and is updated daily on week days.
Initial download of the metrics may take a while.