Open Access
Fig. 4
Download original image
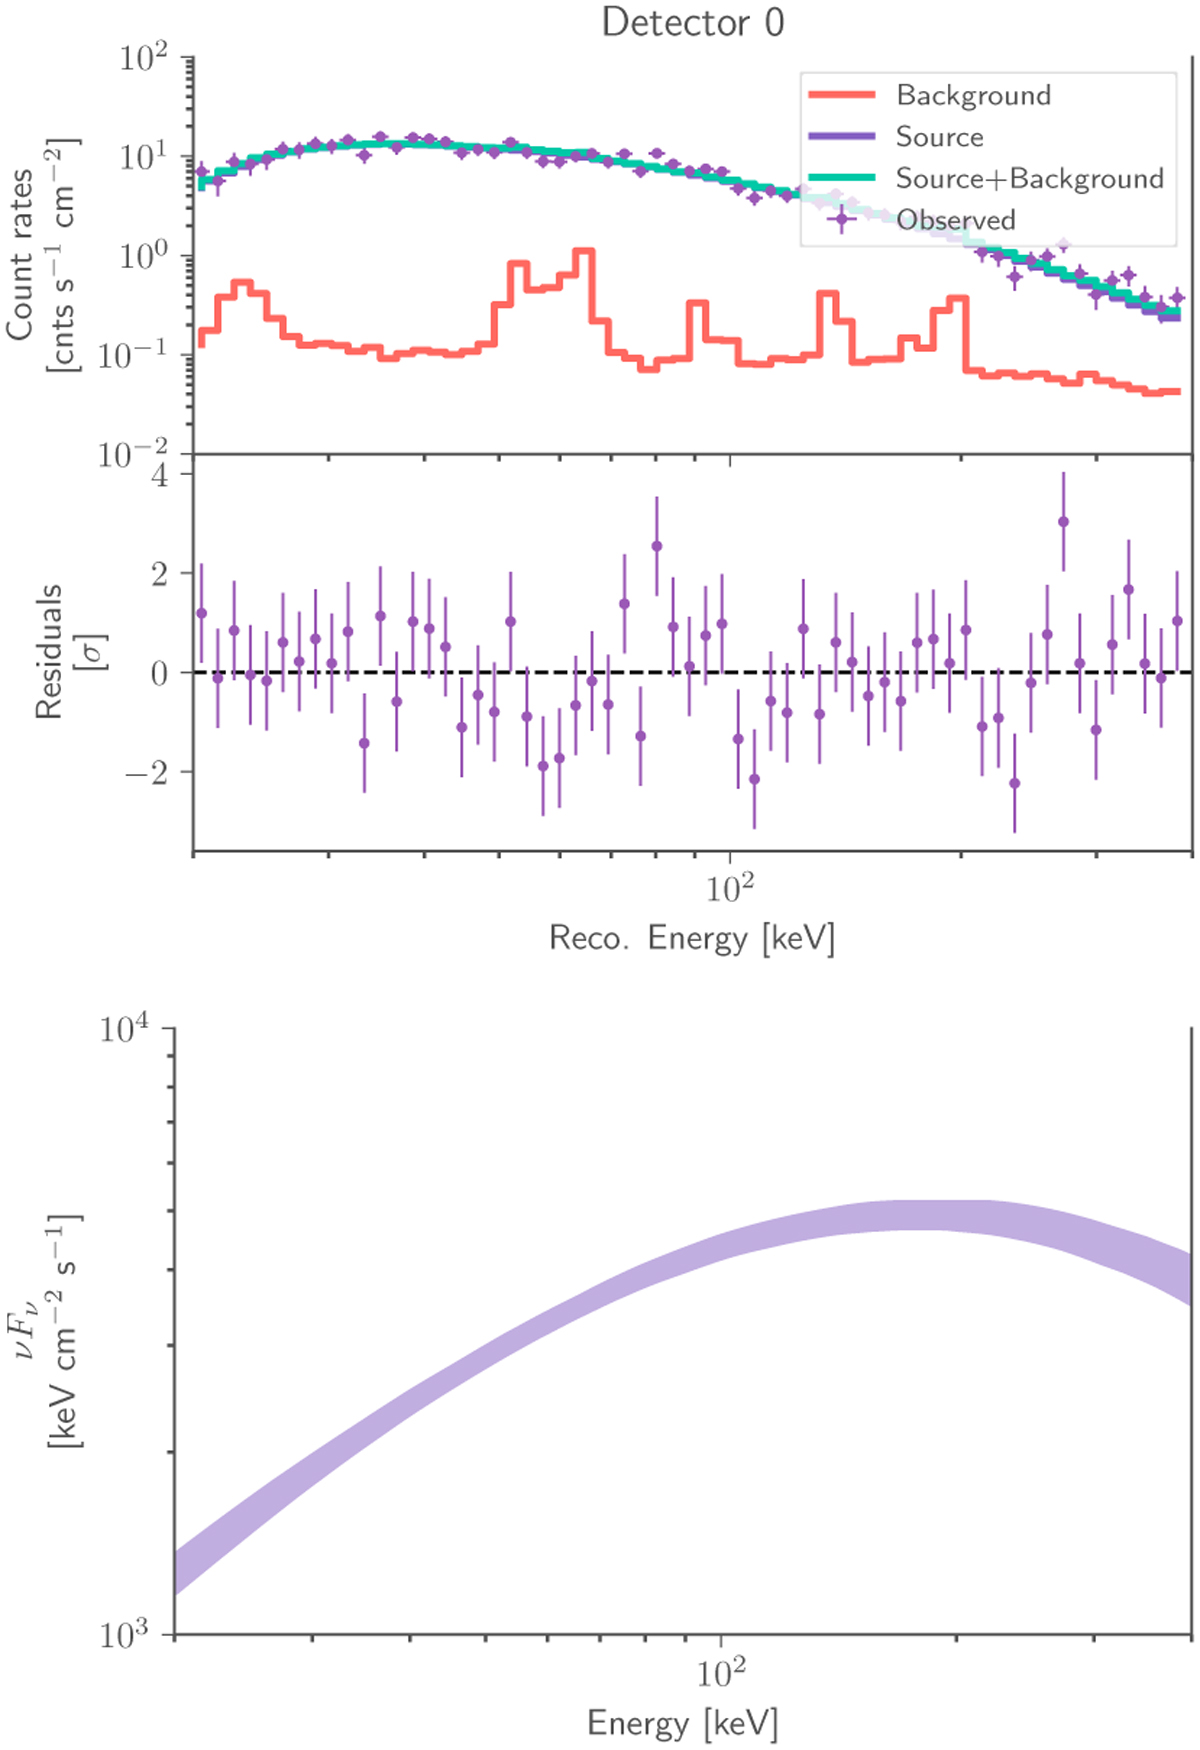
Observed data in the non-PSD energy range of detector 0, over-plotted with the best fit realisation of the synchrotron model for the brightest time bin in our sample (GRB181201A) (top row) and resulting posterior distribution of the vFv spectrum of the GRB (bottom row).
Current usage metrics show cumulative count of Article Views (full-text article views including HTML views, PDF and ePub downloads, according to the available data) and Abstracts Views on Vision4Press platform.
Data correspond to usage on the plateform after 2015. The current usage metrics is available 48-96 hours after online publication and is updated daily on week days.
Initial download of the metrics may take a while.