Open Access
Fig. E.1
Download original image
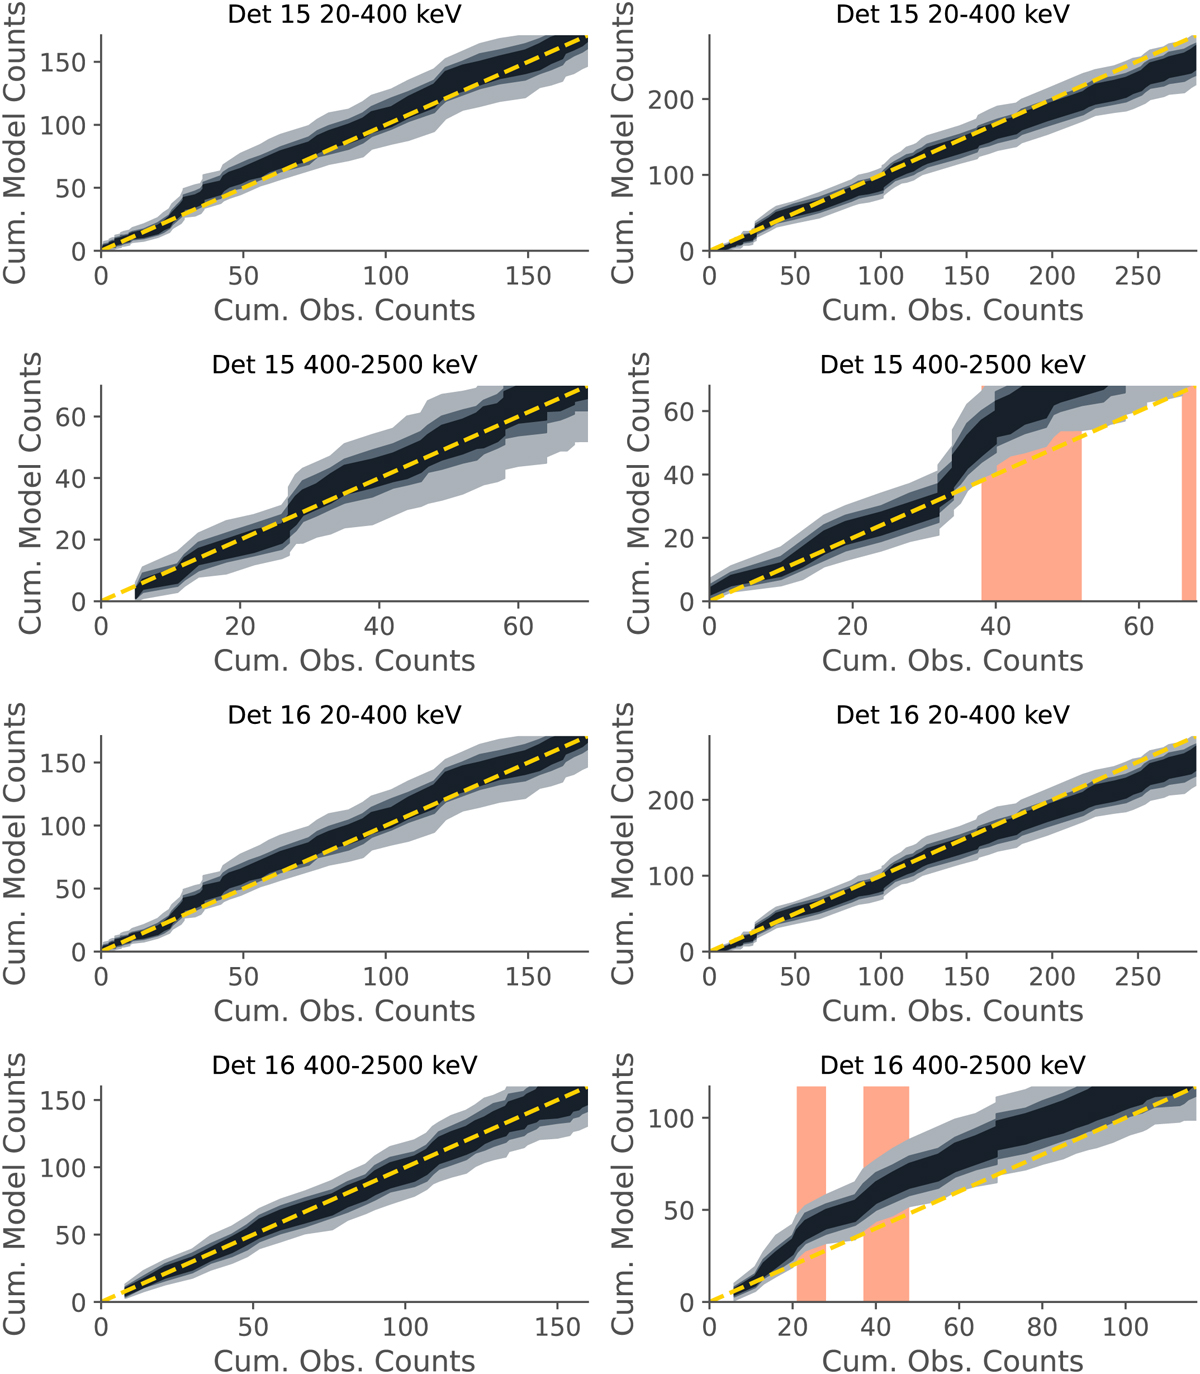
Example of a good fit (left column) and a bad fit (right column). These plots are for the band function fits of two time slices of GRB190411A. The red intervals mark strong deviations (>95 %) of the true data from the simulated data.
Current usage metrics show cumulative count of Article Views (full-text article views including HTML views, PDF and ePub downloads, according to the available data) and Abstracts Views on Vision4Press platform.
Data correspond to usage on the plateform after 2015. The current usage metrics is available 48-96 hours after online publication and is updated daily on week days.
Initial download of the metrics may take a while.