Open Access
Fig. 1
Download original image
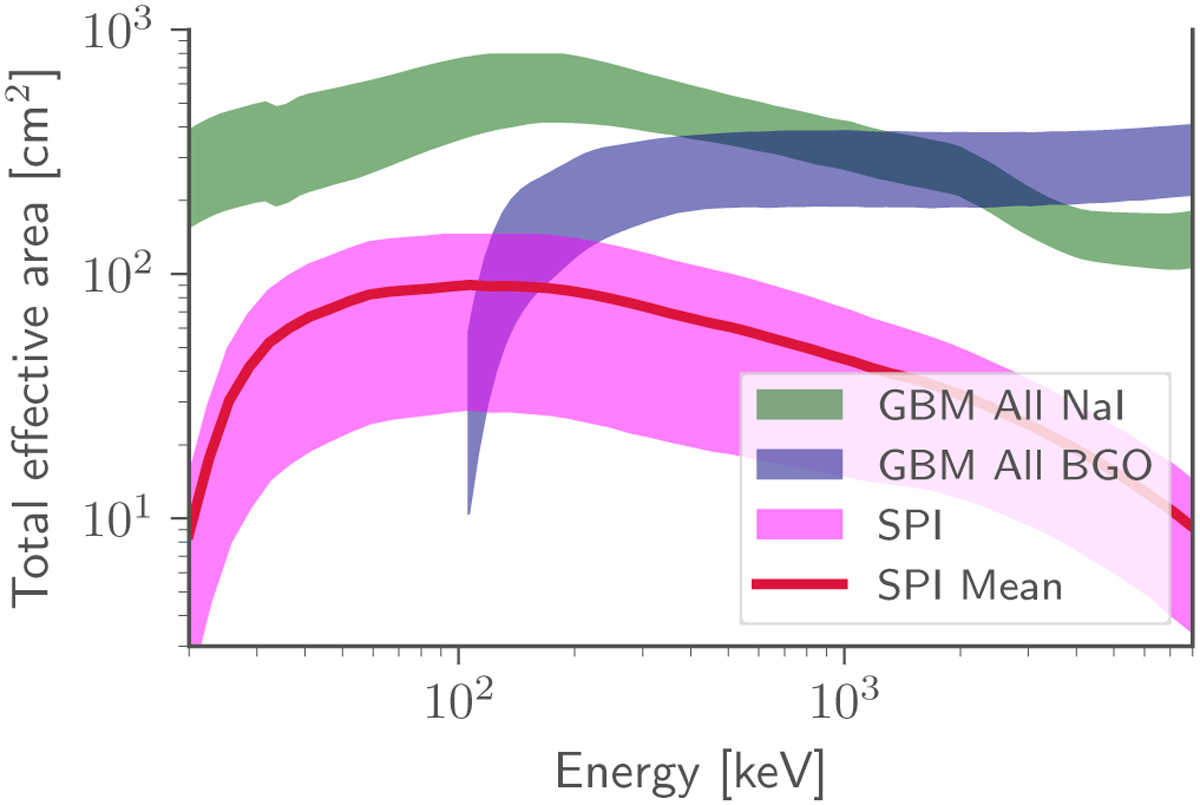
Comparison of the total effective area of GBM and SPI over the SPI energy range. The spread of the lines indicates the full distribution of effective areas depending on the position of the source in the FoV. For SPI, this is restricted to all possible positions in the cFOV and based on the currently valid response version.
Current usage metrics show cumulative count of Article Views (full-text article views including HTML views, PDF and ePub downloads, according to the available data) and Abstracts Views on Vision4Press platform.
Data correspond to usage on the plateform after 2015. The current usage metrics is available 48-96 hours after online publication and is updated daily on week days.
Initial download of the metrics may take a while.