Fig. 9
Download original image
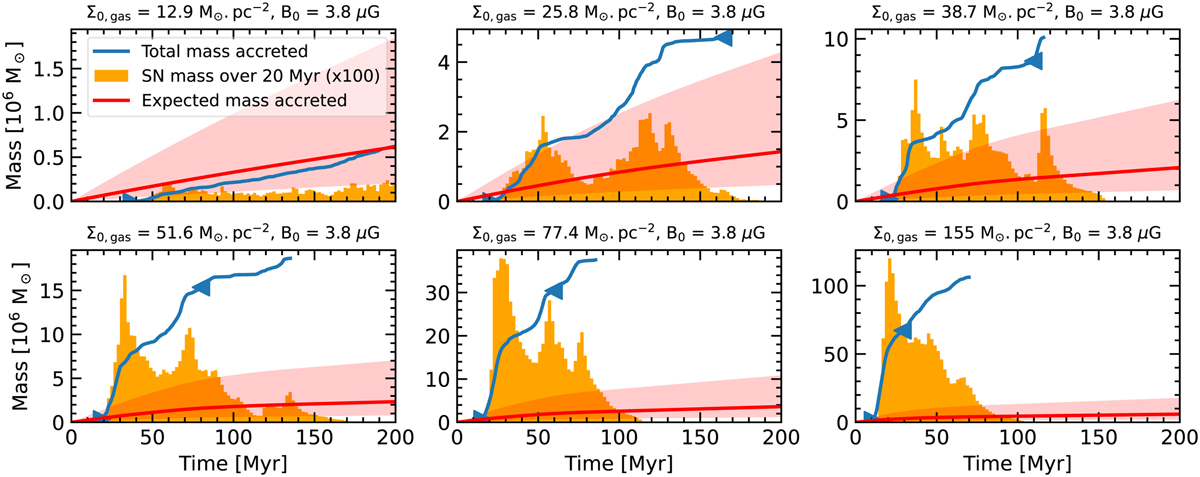
Stellar mass for the group NOTURB. The red line is the stellar mass creation when the SFR in the kiloparsec box is equal to 2.5 × 10⁻³(Σ/10 M⊙ pc−2)14 M⊙ × yr−1 (Kennicutt & Evans 2012). The red zone corresponds to an SFR that is three times higher and lower and aims to represent the spread of the SK relation. The orange histogram is the mass (multiplied by 100 for readability) of stars that blow up into SNe in a time span of 20 Myr. The SFR computation for Fig. 10 starts when 3% of the gas is consumed or lost (t3%, left triangle) and ends when 40% of the gas is consumed or lost (t40%, right triangle).
Current usage metrics show cumulative count of Article Views (full-text article views including HTML views, PDF and ePub downloads, according to the available data) and Abstracts Views on Vision4Press platform.
Data correspond to usage on the plateform after 2015. The current usage metrics is available 48-96 hours after online publication and is updated daily on week days.
Initial download of the metrics may take a while.